Heller Hintergrund mit grünem, punktförmigem Farbverlauf in der unteren rechten Ecke und subtilem Radialverlauf nach innen
Carbon accounting software

Reliable carbon data for customers, auditors, and investors.

Automated CCF, PCF, and reduction calculations on one data foundation. TÜV Rheinland certified and in accordance with ISO 14067, ISO 14064 and GHG Protocol.
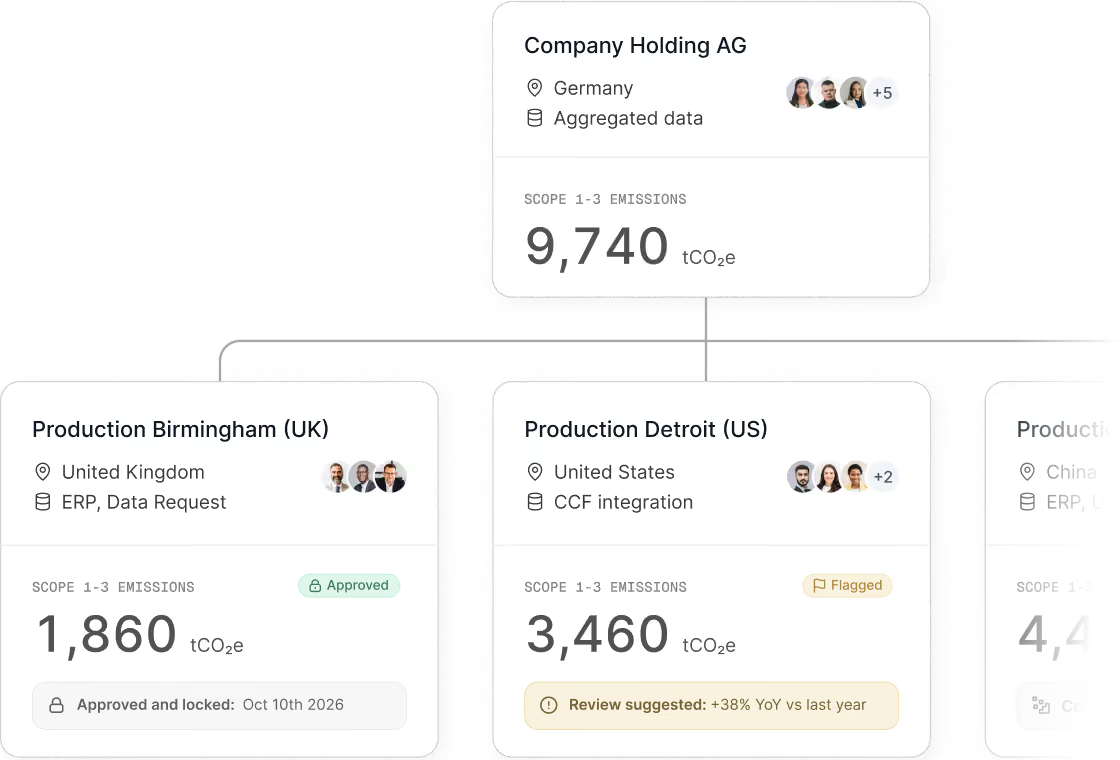

Übersicht der CO2-Emissionen eines Unternehmens mit Gesamtwert 9.740 tCO2e aus Deutschland. Drei Produktionsstandorte zeigen Emissionen: Birmingham (UK) 1.860 tCO2e genehmigt und gesperrt bis 10. Oktober 2026, Detroit (USA) 3.460 tCO2e mit Prüfung empfohlen +38 % gegenüber Vorjahr, und Produktion in China mit 4.420 tCO2e.

What our customers say

iwis
"Tanso is our central solution for carbon accounting and ESG management: a single platform that brings CCF, PCF, and CSRD together seamlessly and creates synergies where duplicate work used to be necessary."
Tatyana Becker
Tatyana Becker
Head of Sustainability Management at iwis
Linhardt
"With Tanso, we were able for the first time to quantify which measures have which CO₂ leverage, what they cost us, and what the ROI will be."
August Wanninger
August Wanninger
Vice President Sustainability & Innovation at Linhardt

Challenges and solutions

After more than 1,000 completed carbon footprints, we know the challenges industrial companies face again and again. Tanso has a concrete solution for each one.

Challenge

More and more customers ask for certified PCFs, and tenders require ISO 14067

Solution

Protect market access and competitiveness

Calculate ISO 14067 PCFs automatically from your bills of materials, using TÜV Rheinland-certified methodology
Export results in customer formats such as Catena-X, Together for Sustainability, and EcoVadis
Illustration eines weißen Quadrats, das von schwarzen und weißen Punkten umgeben ist, die nach rechts und unten hin in einer abnehmenden Dichte angeordnet sind und eine Art Ausbreitung oder Verteilung darstellen.
Challenge

CSRD, EU Taxonomy, CBAM, and growing auditor requirements demand audit-ready data

Solution

Reduce regulatory risk

Integrated audit trail with dedicated auditor access, versioned emission factors, and multi-stage approval processes
TÜV Rheinland-certified methodology aligned with the GHG Protocol, ISO 14064, the EU Taxonomy, and SBTi
Illustration eines weißen Quadrats, das von schwarzen und weißen Punkten umgeben ist, die nach rechts und unten hin in einer abnehmenden Dichte angeordnet sind und eine Art Ausbreitung oder Verteilung darstellen.
Challenge

Unclear ownership and fluctuating data quality across legal entities and sites cause high manual effort

Solution

Scale data collection across complex organizations

Decentralized task management with granular ownership at site and department level
Data collection assisted by Tanso AI and a dashboard for real-time visibility
Illustration eines weißen Quadrats, das von schwarzen und weißen Punkten umgeben ist, die nach rechts und unten hin in einer abnehmenden Dichte angeordnet sind und eine Art Ausbreitung oder Verteilung darstellen.
Challenge

Fear of a big-bang approach, or that data quality isn't there yet

Solution

Start pragmatically, grow with your maturity

Start with spend-based emission factors (Exiobase, CEDA) and even with incomplete data
Quantity-based factors for higher precision, without having to rebuild the system
Illustration eines weißen Quadrats, das von schwarzen und weißen Punkten umgeben ist, die nach rechts und unten hin in einer abnehmenden Dichte angeordnet sind und eine Art Ausbreitung oder Verteilung darstellen.
Challenge

Reduction levers stay unprioritized because emissions data isn't linked to operational and financial metrics

Solution

Prioritize reduction measures based on data

Prioritize measures based on MAC curves and manage investments, savings potential, and implementation timelines per measure
Derive SBTi-aligned targets directly from your carbon footprint
Illustration eines weißen Quadrats, das von schwarzen und weißen Punkten umgeben ist, die nach rechts und unten hin in einer abnehmenden Dichte angeordnet sind und eine Art Ausbreitung oder Verteilung darstellen.

Results with Tanso

<8

weeks to a complete carbon footprint

80%

recurring time savings in the following years

3×

more accurate emission factor mapping

“We founded Tanso because there was no solution that brought corporate-level and product-level carbon accounting together in the way industrial companies need. Decarbonizing industry is a huge challenge, and it can only succeed if we empower the entire supply chain, not just individual companies.”

Gyri Reiersen
CPO and Co-Founder of Tanso
Frau mit schulterlangem braunem Haar blickt nach rechts, weiches Seitenlicht betont Gesicht und Schatten an heller Wand

Science-based emission factors

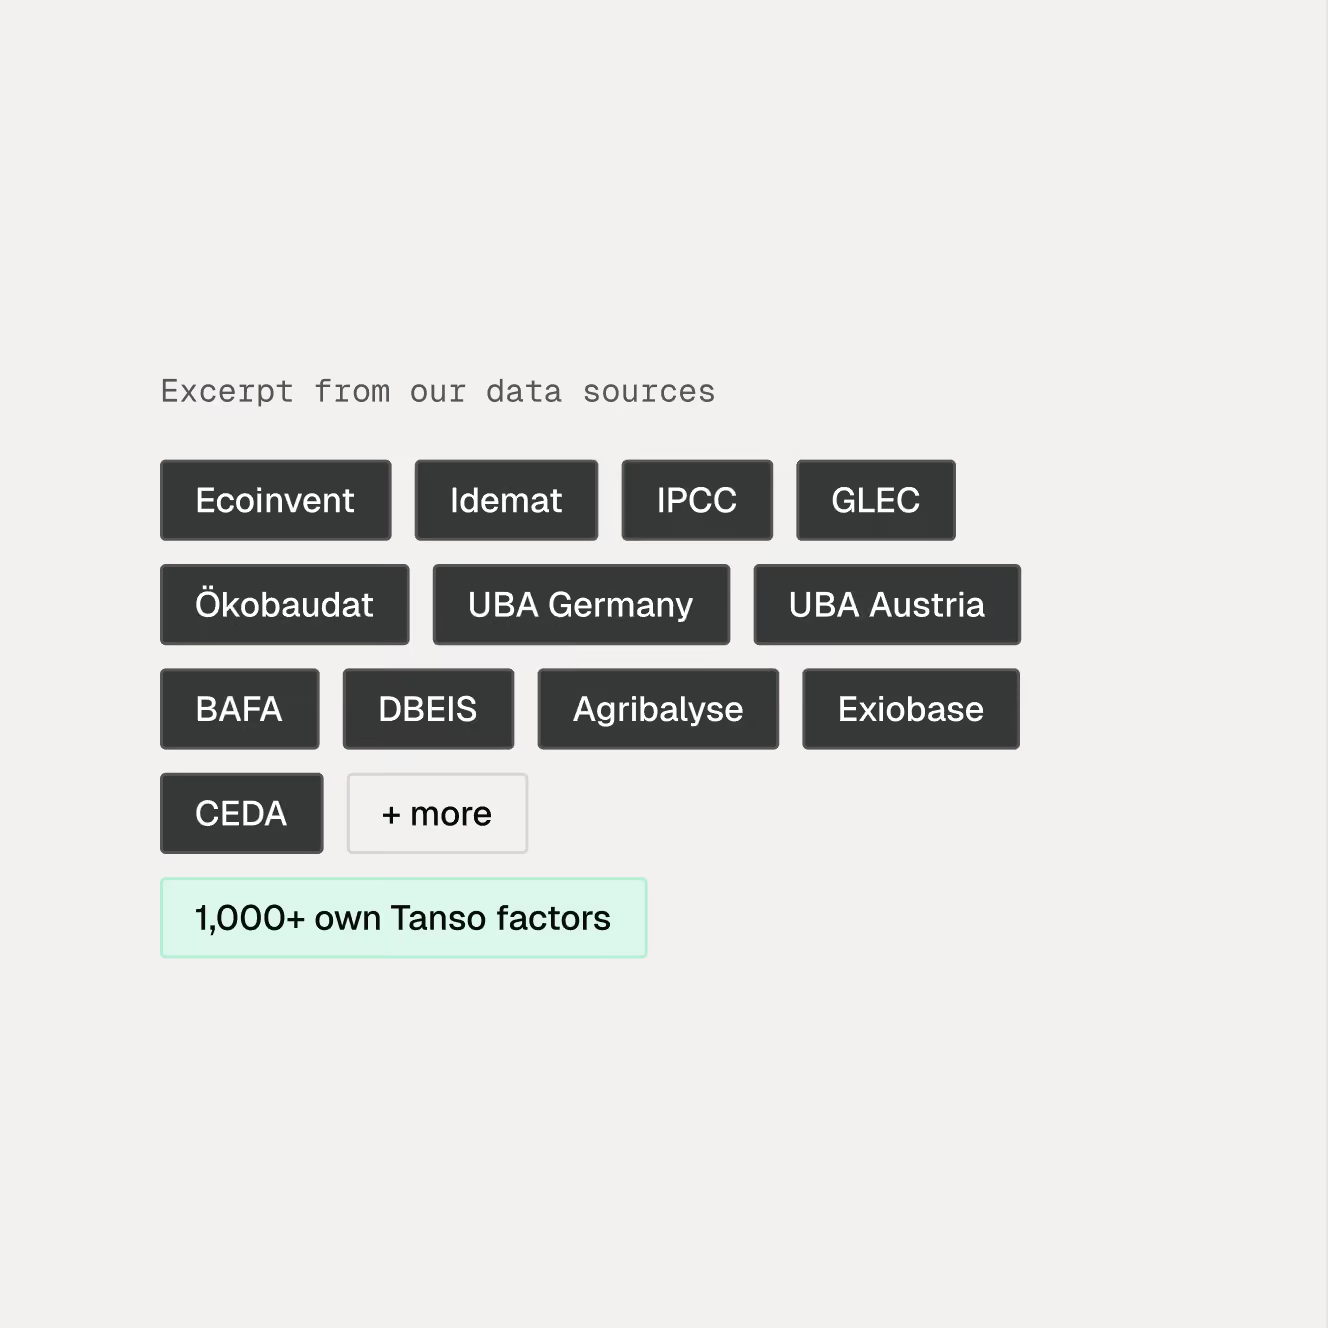
Your carbon footprint is only as reliable as the emission factors behind it. Tanso offers 30,000+ emission factors from 14 recognized databases, curated for industrial companies.

Schwarzes einfaches Fabrik- oder Industriegebäude-Symbol vor einem grünen Hintergrund.

30,000+ emission factors

Curated for industrial companies

14 recognized databases

Ecoinvent, IPCC, Ökobaudat, GLEC, and more

Weißes Symbol mit drei Häkchen in einem Quadrat auf schwarzem Hintergrund.

1,000+ proprietary emission factors

Where standard databases stop

Data quality and methodology

Consistent methodology as a core principle

Every emission factor follows harmonized allocation principles, established life cycle impact assessment (LCIA) methods, and clearly defined system boundaries. This keeps your results comparable across years and sites.
Harmonized allocation principles and LCIA methods: IPCC 2021, ReCiPe, CML, EF 3.1
Biogenic CO₂ emissions are reported separately, and all greenhouse gases are fully covered
Spend-based to get started, activity-based for higher maturity, updated annually
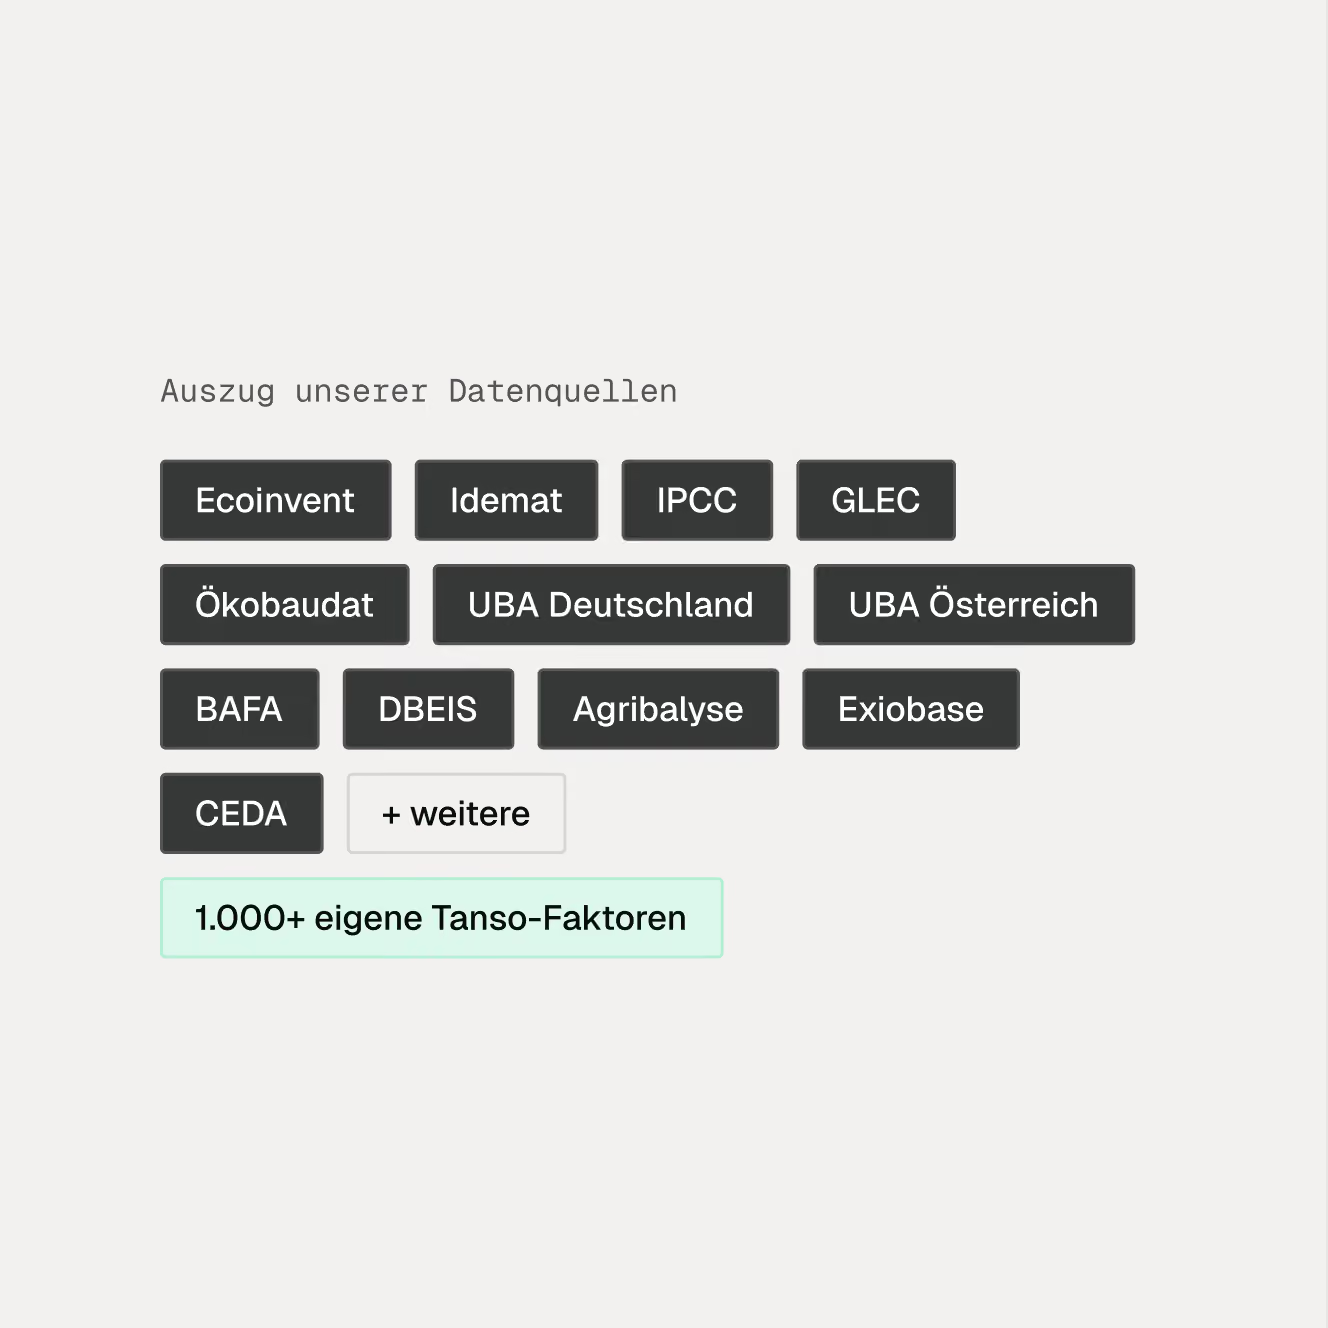
Liste von Datenquellen mit Beschriftung Auszug unserer Datenquellen, darunter schwarze Rechtecke mit den Namen Ecoinvent, Idemat, IPCC, GLEC, Ökobaudat, UBA Deutschland, UBA Österreich, BAFA, DBEIS, Agribalyse, Exiobase, CEDA, ein weißes Rechteck mit + weitere sowie ein grünes Rechteck mit der Beschriftung 1.000+ eigene Tanso-Faktoren.Liste von Datenquellen mit den Namen Ecoinvent, Idemat, IPCC, GLEC, Ökobaudat, UBA Germany, UBA Austria, BAFA, DBEIS, Agribalyse, Exiobase, CEDA und einem Hinweis auf weitere Quellen sowie 1.000+ eigene Tanso-Faktoren.

Modules for your carbon accounting

Corporate Carbon Footprint (CCF)

Audit-ready Scope 1, 2, and 3 footprint for your entire organization
Combines TÜV Rheinland-certified methodology with industrial-grade Scope 3 modeling for complex manufacturing structures
The basis for customer, bank, and investor requests as well as CSRD reporting
Organisationsdiagram einer Firma mit Hauptgesellschaft in Deutschland und Tochtergesellschaften in den USA, Großbritannien und China, daneben ein Kreisdiagramm mit CO2-Emissionen nach Umfang: Gesamt 2.222.299 tCO2e, Scope 1: 73.459,05 tCO2e (3,31 %), Scope 2: 217.034,97 tCO2e (9,77 %), Scope 3: 1.931.804,58 tCO2e (86,93 %).

Product Carbon Footprint (PCF)

Audit-ready, ISO 14067-compliant PCFs for climate-sensitive value chains
AI-assisted BoM processing and emission factor mapping with up to 3x higher accuracy
Scalable from your first pragmatic PCF to automated calculation across your entire portfolio via PCF API
PCF-Bericht der Demo Company GmbH zeigt eine Materialliste mit Gesamtemissionen von 412,6 kgCO2e, Produkteemissionen 409,0 kgCO2e und Verpackungsemissionen 3,6 kgCO2e; Tortendiagramm visualisiert Emissionen, Tabelle listet Electric Motor mit 42%, Aluminiumguss mit 28% und Schaltschrank mit 18% der Emissionen auf.

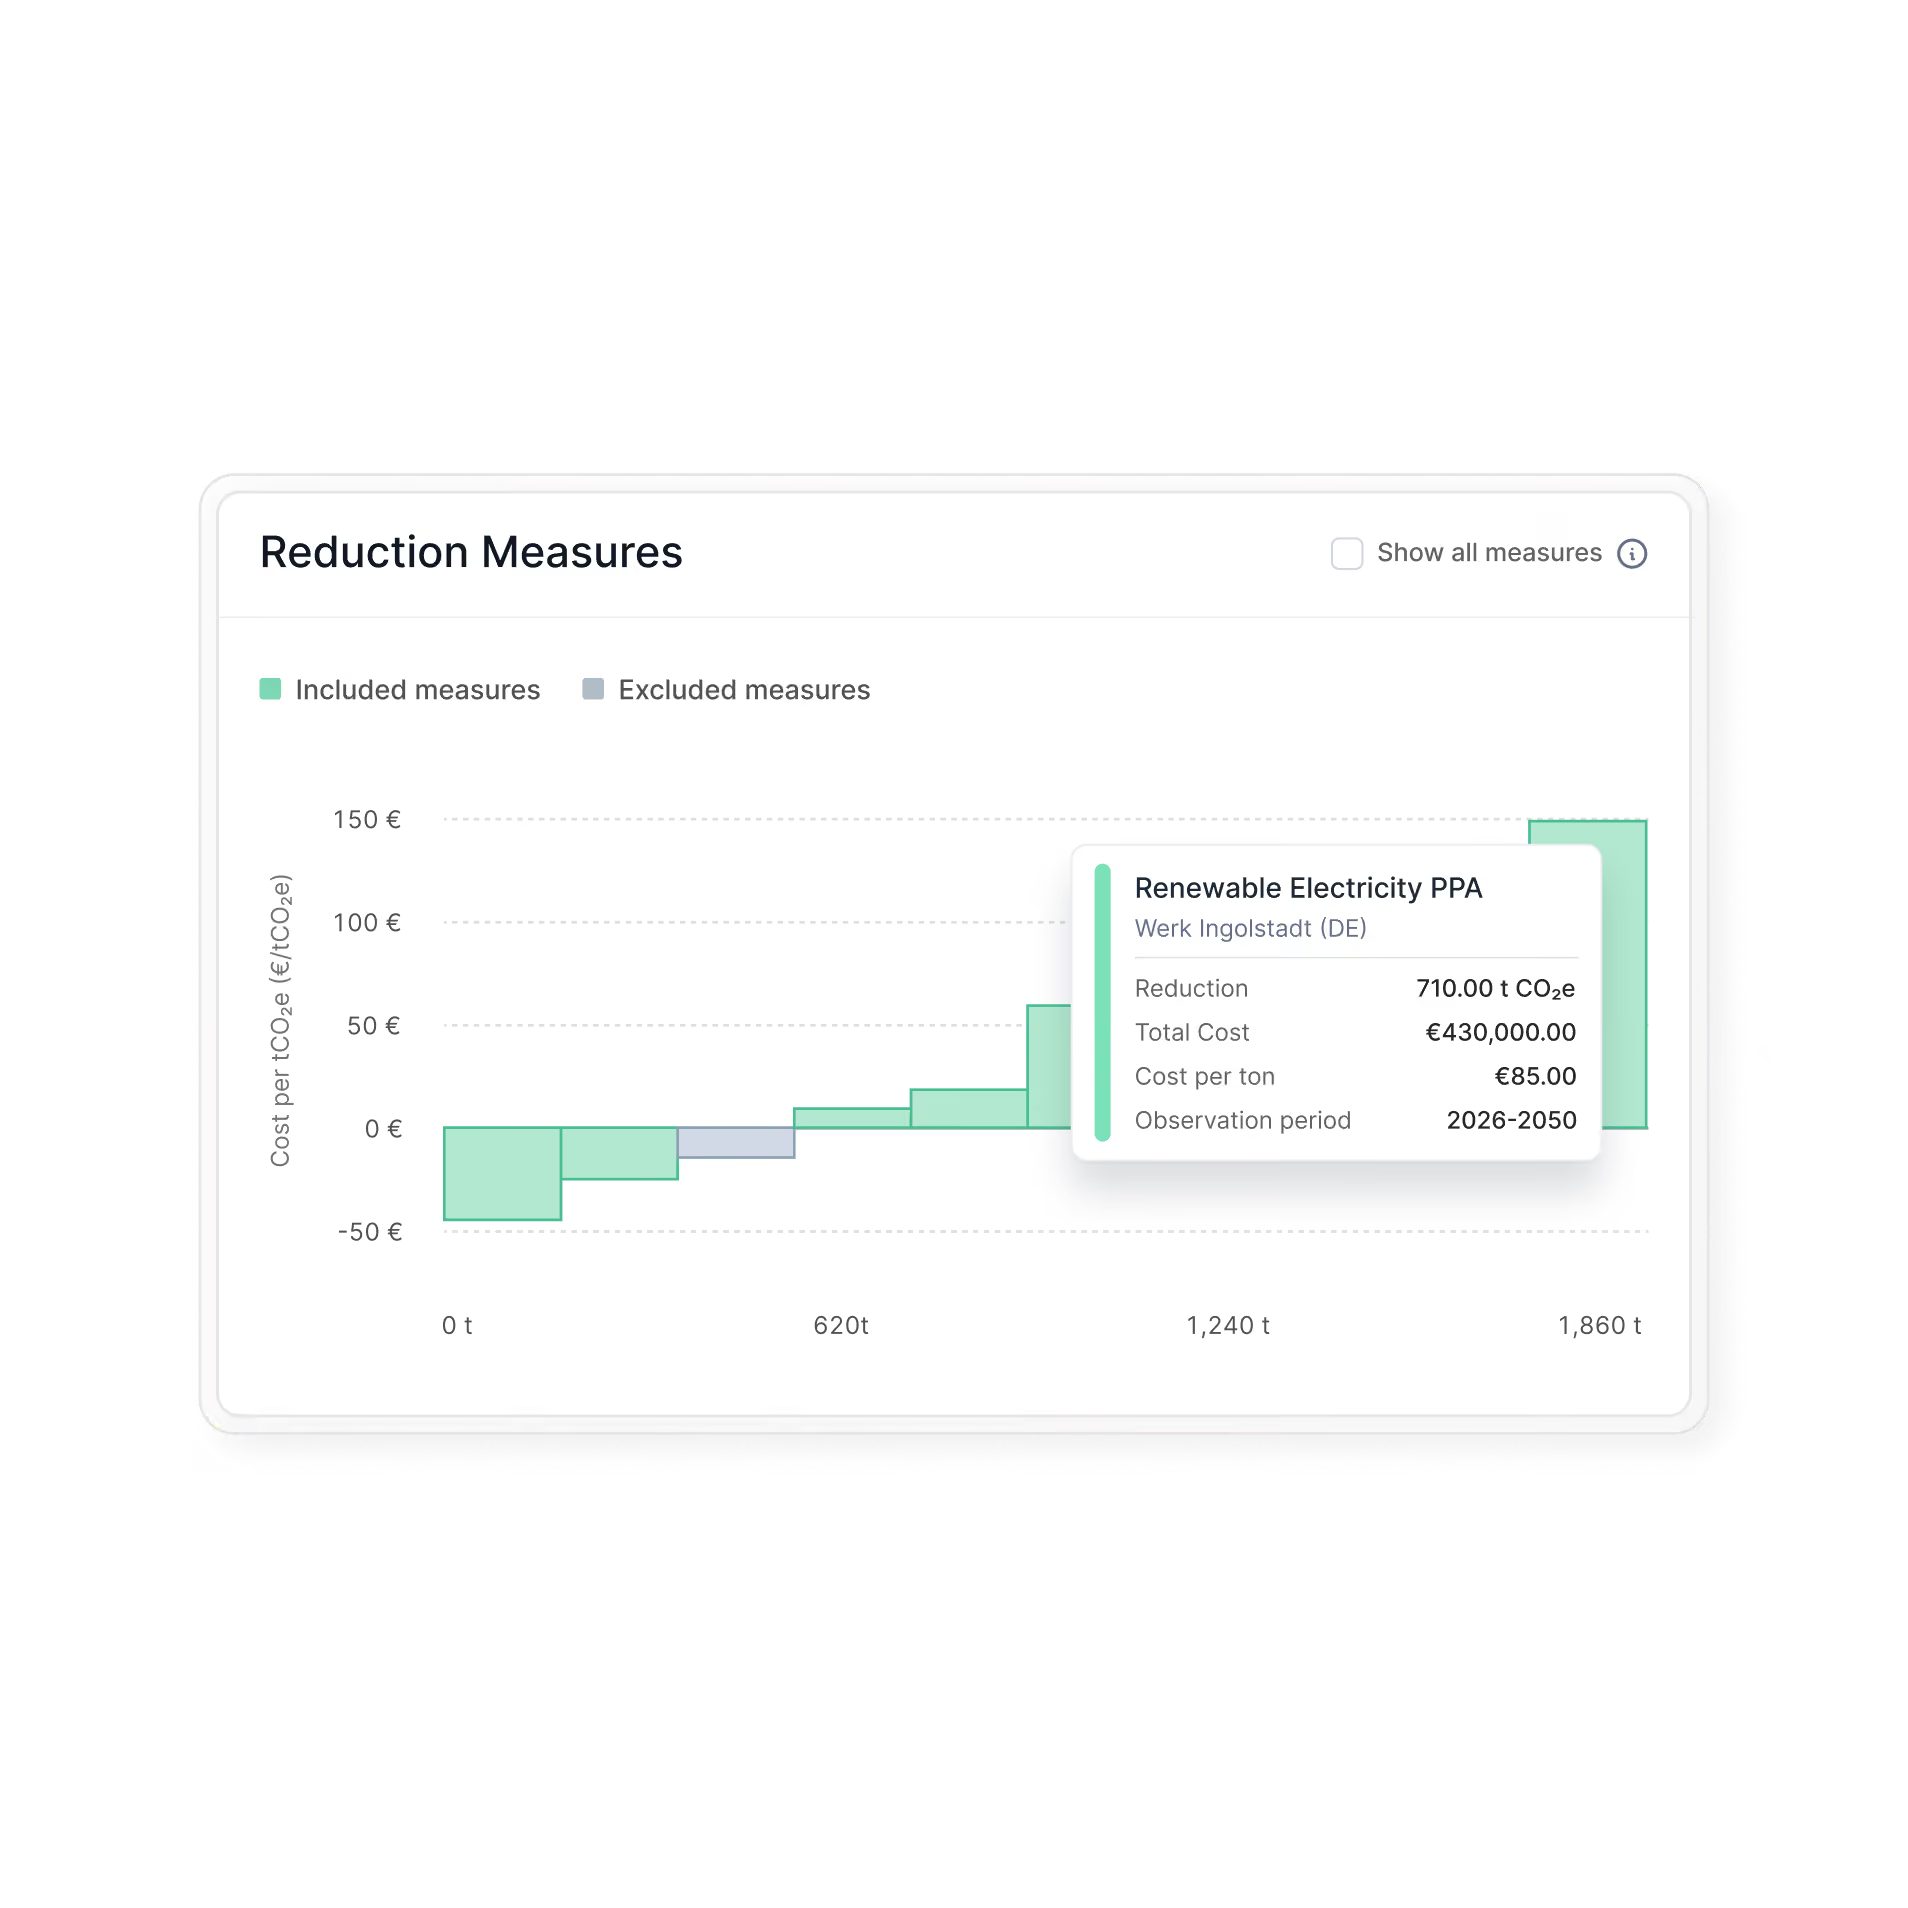
Reduction

Data-driven climate strategy based on your CCF and PCF data
SBTi-aligned target setting, MAC curve prioritization, and scenario comparison
Reduction measures operationally steerable with investments and savings potential
Diagramm der Reduktionsmaßnahmen mit Balken, die eingeschlossene (grün) und ausgeschlossene Maßnahmen (grau) zeigen; hervorgehoben ist die Maßnahme "Renewable Electricity PPA" für Werk Ingolstadt, die eine CO2-Reduktion von 710 Tonnen, Gesamtkosten von 430.000 € und Kosten pro Tonne von 85 € im Beobachtungszeitraum 2026-2050 aufweist.

Your carbon footprint in five steps

Step 1: Connect your data

Import from ERP systems, Excel, or via API. No ERP overhaul required.

Step 2: Decentralize data collection

Assign responsibilities by site, department, or legal entity. Tanso AI supports data entry and validation.

Step 3: Calculate emissions automatically

Tanso maps activity data to the right emission factors and calculates your footprint according to the GHG Protocol, ISO 14064, or ISO 14067, using TÜV Rheinland-certified methodology.

Step 4: Identify hotspots and plan reductions

Automatic breakdown by scope, site, activity, and product. Prioritize measures with marginal abatement cost curves (MACC).

Step 5: Share and export results

Export audit-ready reports, PCFs in customer formats (Catena-X, TfS, and EcoVadis), and your CCF for CSRD reporting.

More carbon accounting resources

Talk to our carbon management experts.

In a live session, we'll show you:
Your specific use cases: CCF, PCF, or reduction
A live demo of the platform with examples from your industry
How Tanso fits into your existing IT landscape (SAP, ERP)
Blaues Quadrat mit weißem ISO-Logo: stilisierte Weltkugel und ISO-Schriftzug oben rechts
ISO/IEC 27001
grün-gelbes, stilisiertes Logo mit verschlungenen Buchstaben S und P, abgerundete Ecken und weißer Umrandung auf weißem Hintergrund
Catena-X
Abstraktes, zweifarbiges Icon: oben roter, unten goldgelber horizontaler Halbkreis, klare Kanten, flache Darstellung
Developed & hosted in Germany
Request a consultation
Türkisfarbene, gepunktete Farbschicht verläuft diagonal über dunklen Hintergrund, wirkt wie digitaler Farbschleier

Frequently asked questions

How does Tanso fit into our existing IT landscape (SAP, ERP, PLM)?

Tanso is ERP, PLM and data lake compatible. You get started with structured CSV imports, and API integrations with SAP or other systems can follow later. No ERP overhaul required.

Can I start with incomplete data?

Yes. Tanso supports a stepwise maturity model: you start with spend-based calculations (Exiobase, CEDA) and recognized secondary factors, then gradually improve data quality with quantity-based factors and primary data from the supplier portal, without having to rebuild the system.

What is the difference between a CCF and a PCF?

The corporate carbon footprint (CCF) accounts for all of a company's emissions across Scope 1, 2 and 3. The product carbon footprint (PCF) captures the emissions of a single product across its life cycle according to ISO 14067. Tanso covers both on the same data foundation, so you can collect data once and use it for both use cases.

Which emission factor databases does Tanso use?

Tanso integrates 14 recognized databases, including Ecoinvent, Idemat, IPCC, GLEC, Ökobaudat, UBA Germany and Austria, as well as Exiobase and CEDA for spend-based calculations. From more than 100,000 available factors, we display 30,000+ curated, ready-to-use factors. We have also developed more than 1,000 proprietary emission factors for activities that standard databases do not cover. For many industry-specific factors, benchmarking against industry values is available.

Which Scope 3 categories are covered?

All 15 categories of the GHG Protocol. We offer particular depth in Scope 3.1 (purchased goods and services), 3.4 (upstream transportation), 3.10 (processing of sold products) and 3.11 (use of sold products). Industry-specific emission factors are available for every category.

How long does implementation take?

Usually less than 8 weeks until your first complete CCF. PCF calculations for your first products are often possible within the first few weeks, since BoM import and emission factor mapping are automated.

How do I deliver PCF data for Catena-X, Together for Sustainability or EcoVadis?

Tanso exports PCF data directly in the standardized formats of these initiatives. For Catena-X, we work with sovity as a certified connector provider, so data is transferred to OEM systems via the official Catena-X standard.

weißes Logo mit dem Schriftzug tanso auf schwarzem Hintergrund, abgerundete Kleinbuchstaben, modernes Logo.

Tanso is the ESG and carbon accounting software trusted by industrial companies across the DACH region to stay competitive and compliant.

700+ industrial companies trust Tanso
Stay in the loop

ESG and carbon updates from industrial practice, straight to your inbox.