Heller Hintergrund mit grünem, punktförmigem Farbverlauf in der unteren rechten Ecke und subtilem Radialverlauf nach innen
ESG reporting software

One data foundation for CSRD, VSME, and customer ratings.

From double materiality assessment to digital XBRL report. Reliable ESG reports for customers, auditors, and investors.
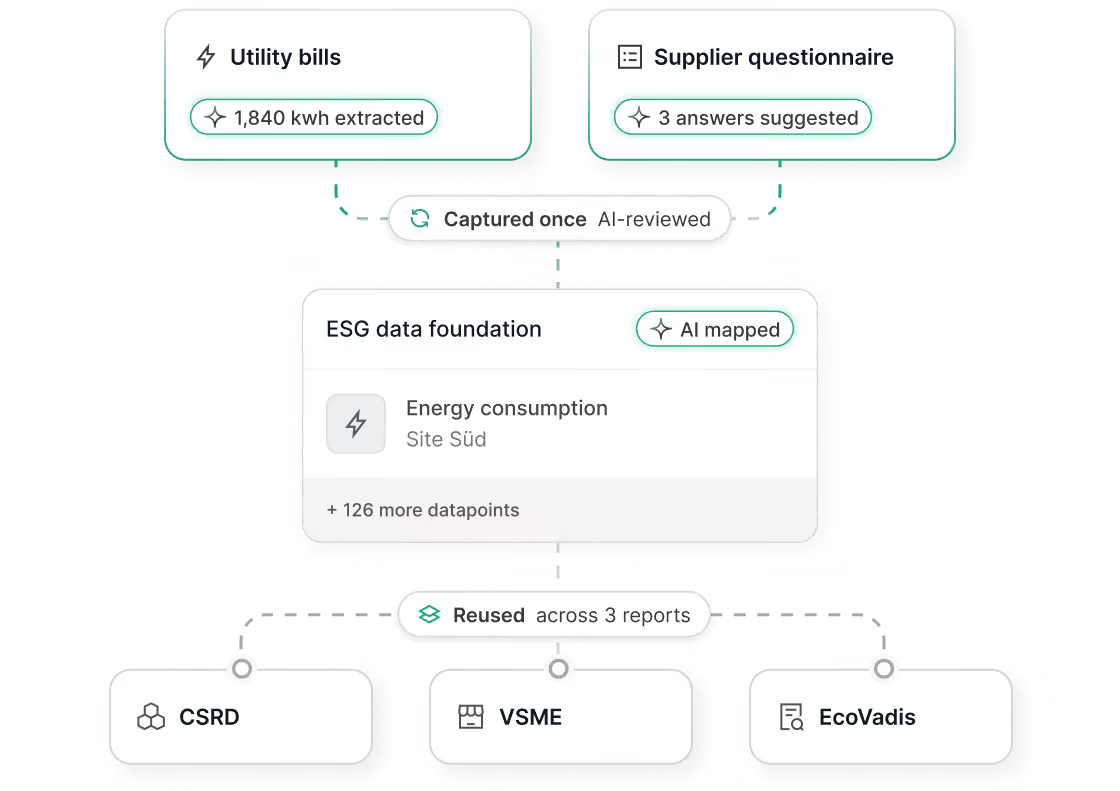
Flussdiagramm des ESG-Datenmanagements mit zwei Eingaben: 'Stromrechnungen' mit 1.840 kWh extrahiert und 'Lieferantenfragebogen' mit 3 vorgeschlagenen Antworten, beide einmal erfasst und KI-überprüft. Diese führen zur ESG-Datenbasis mit KI-zugeordnetem Energieverbrauch für Standort Süd und 126 weiteren Datenpunkten. Die Daten werden wiederverwendet in den drei Berichten: CSRD, VSME und EcoVadis.

What our customers say

Crespel & Deiters
"The intuitive interface of the Tanso software, combined with simple and decentralized data collection and reliable support, makes Tanso an indispensable tool for our sustainability reporting."
Jan-Oliver Hense
Jan-Oliver Hense
Head of Energy Management at Crespel & Deiters
GOLDBECK
"Tanso is far more than a tool for meeting CSRD requirements for us. It's the central foundation for holistic sustainability data management. Since all information is bundled centrally, we no longer need time-consuming individual coordination with different departments, which creates noticeable efficiency gains."
Céline Kählers
Céline Kählers
Strategic Sustainability Managerin at GOLDBECK
WEISS
"We use our VSME report as the central foundation for external ratings like EcoVadis and CDP, which lets us provide the required metrics and evidence all in one place."
Saskia Höge
Saskia Höge
Project Management Specialist at WEISS

Challenges and solutions

Working with more than 700 industrial customers on hundreds of reports, we know the challenges that come up again and again. Tanso has a concrete solution for each one.

Challenge

Manual data collection takes too much time

Solution

Tanso bundles requests for hundreds of datapoints into one multilingual request per person and site

AI-powered data extraction from uploaded invoices, certificates, or codes of conduct takes over manual data entry
Campaigns run monthly, quarterly, or annually instead of as a one-off rush
Illustration eines weißen Quadrats, das von schwarzen und weißen Punkten umgeben ist, die nach rechts und unten hin in einer abnehmenden Dichte angeordnet sind und eine Art Ausbreitung oder Verteilung darstellen.
Challenge

Every report starts from zero

Solution

Tanso manages sustainability KPIs centrally

Each KPI is defined and collected once, then reused across all relevant standards
AI-powered datapoint mapping automatically matches KPIs to the requirements of CSRD, VSME, EcoVadis, SAQ 5.0 and GRI
Illustration eines weißen Quadrats, das von schwarzen und weißen Punkten umgeben ist, die nach rechts und unten hin in einer abnehmenden Dichte angeordnet sind und eine Art Ausbreitung oder Verteilung darstellen.
Challenge

Auditors demand complete evidence

Solution

Multi-level approval workflows and dedicated auditor access make every report audit-ready

Complete audit trail: every answer, change, and attached document stays traceable and is automatically consolidated at every level of your organization
XBRL support for digital submission
Illustration eines weißen Quadrats, das von schwarzen und weißen Punkten umgeben ist, die nach rechts und unten hin in einer abnehmenden Dichte angeordnet sind und eine Art Ausbreitung oder Verteilung darstellen.
Challenge

The Double Materiality Assessment (DMA) feels overwhelming

Solution

Tanso guides you through an AI-powered DMA workflow with an industry-specific IRO generator

You assess and add to suggested impacts, risks, and opportunities in a structured, guided process
The relevant ESRS datapoints are derived automatically from your DMA results
Illustration eines weißen Quadrats, das von schwarzen und weißen Punkten umgeben ist, die nach rechts und unten hin in einer abnehmenden Dichte angeordnet sind und eine Art Ausbreitung oder Verteilung darstellen.
Challenge

The executive board and CFO ask for ESG data to make internal decisions

Solution

Tanso analyzes collected data fields and visualizes them at every level of your organization, aggregated freely over time and dimensions

Calculated KPIs (e.g., emissions per 1,000 employees, energy costs per revenue) link sustainability figures to operational ones
Stakeholder requests that used to take two days in Excel are now a single query
Illustration eines weißen Quadrats, das von schwarzen und weißen Punkten umgeben ist, die nach rechts und unten hin in einer abnehmenden Dichte angeordnet sind und eine Art Ausbreitung oder Verteilung darstellen.

Results with Tanso

80%

recurring time savings

19.5

average point increase in EcoVadis scores

500+

ESG reports supported

Powerful ESG data management

One central, reusable data foundation that grows with your requirements, so you don't start from scratch with every new standard.

Ein einfaches schwarzes Symbol einer Datenbank mit drei übereinander liegenden Scheiben auf einem einfarbigen hellgrünen Hintergrund.

Manage KPIs centrally

Emissions, energy use, and workforce data across every report and standard

Collect once, use many times

Reusable for reports, analyses, and AI applications

Weißes Symbol eines Keimlings mit zwei Blättern auf schwarzem Hintergrund.

Calculated KPIs

Sustainability data linked to operational metrics

Data management

Data management with full control

Bundled data requests replace scattered one-off requests to sites and teams, with a complete audit trail across every level of your organization.
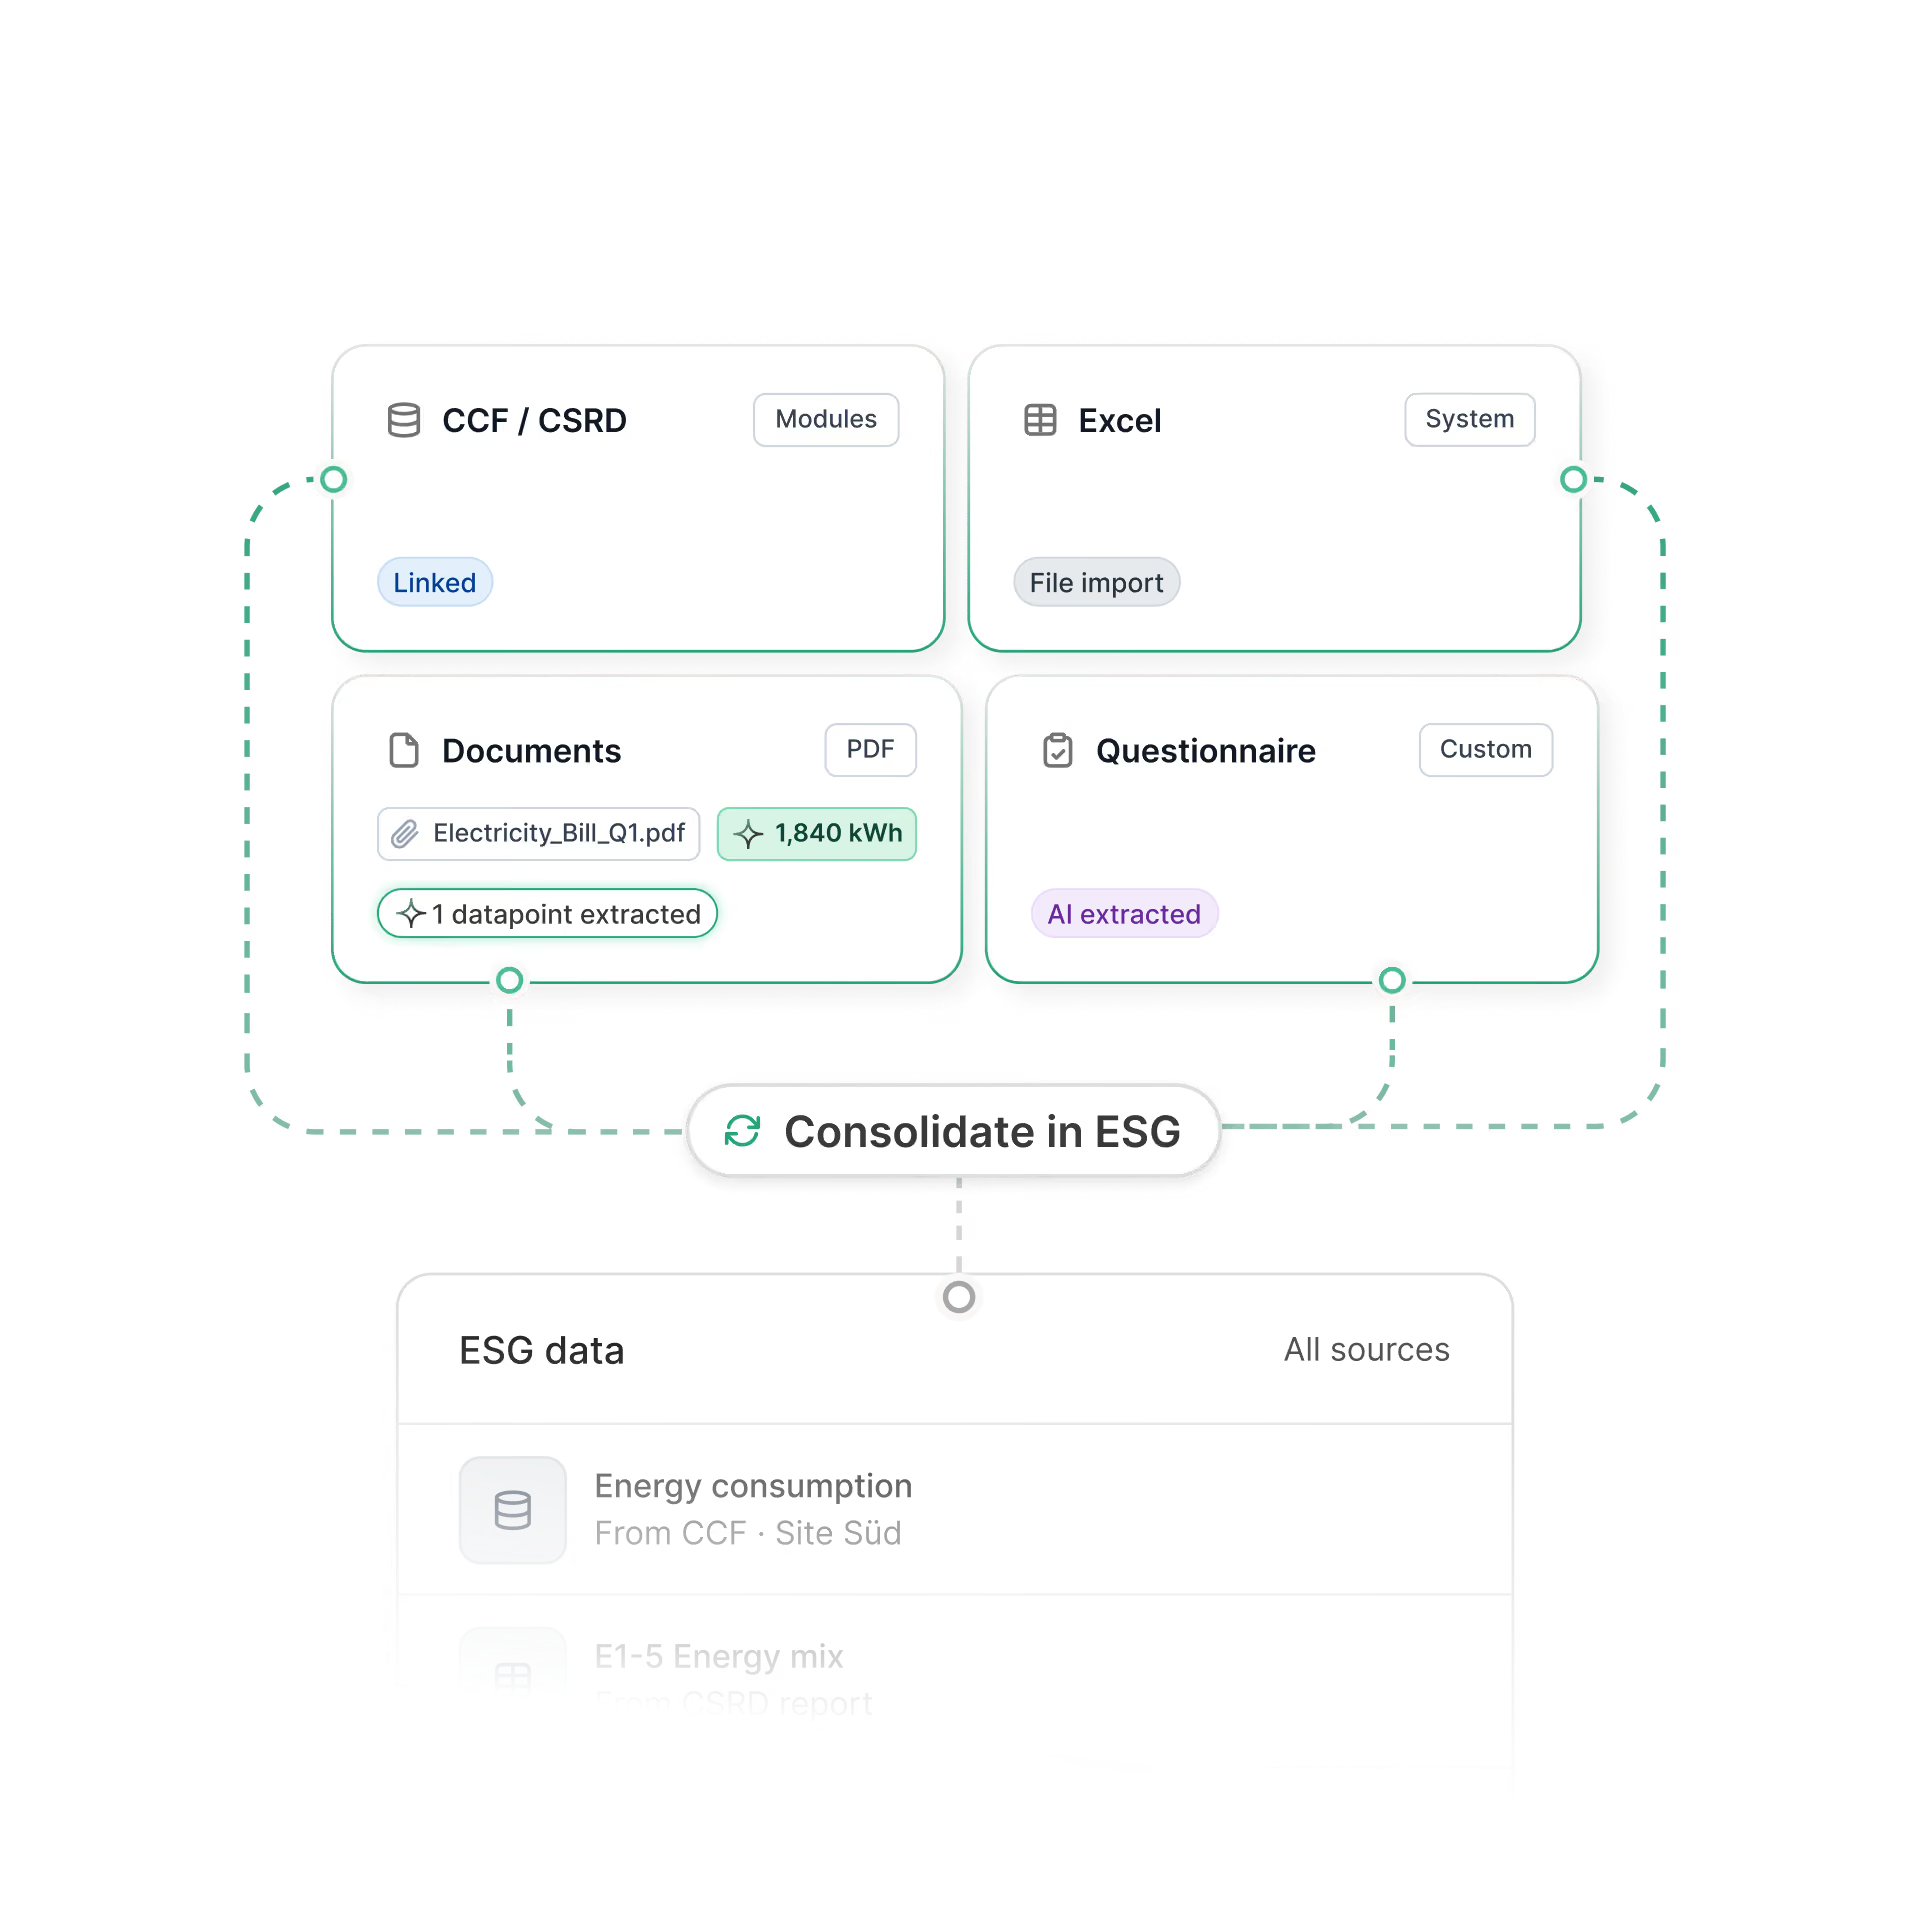
Tanso AI consolidates all data requests and your central document library into one consistent, company-wide answer, with a reference to each original source
Diagram zeigt vier Datenquellen: CCF / CSRD Module (verbunden), Excel System (Dateiimport), Dokumente PDF mit extrahiertem Datenpunkt von 1840 kWh, und benutzerdefinierter Fragebogen mit KI-Extraktion. Diese Quellen sind über gestrichelte Linien verbunden zu einer Schaltfläche 'Konsolidieren in ESG'. Darunter ist ein Bereich 'ESG-Daten' mit Einträgen wie 'Energieverbrauch von CCF Site Süd' und 'E1-5 Energiemix aus CSRD-Bericht'.

Modules for your ESG reporting

CSRD and ESRS
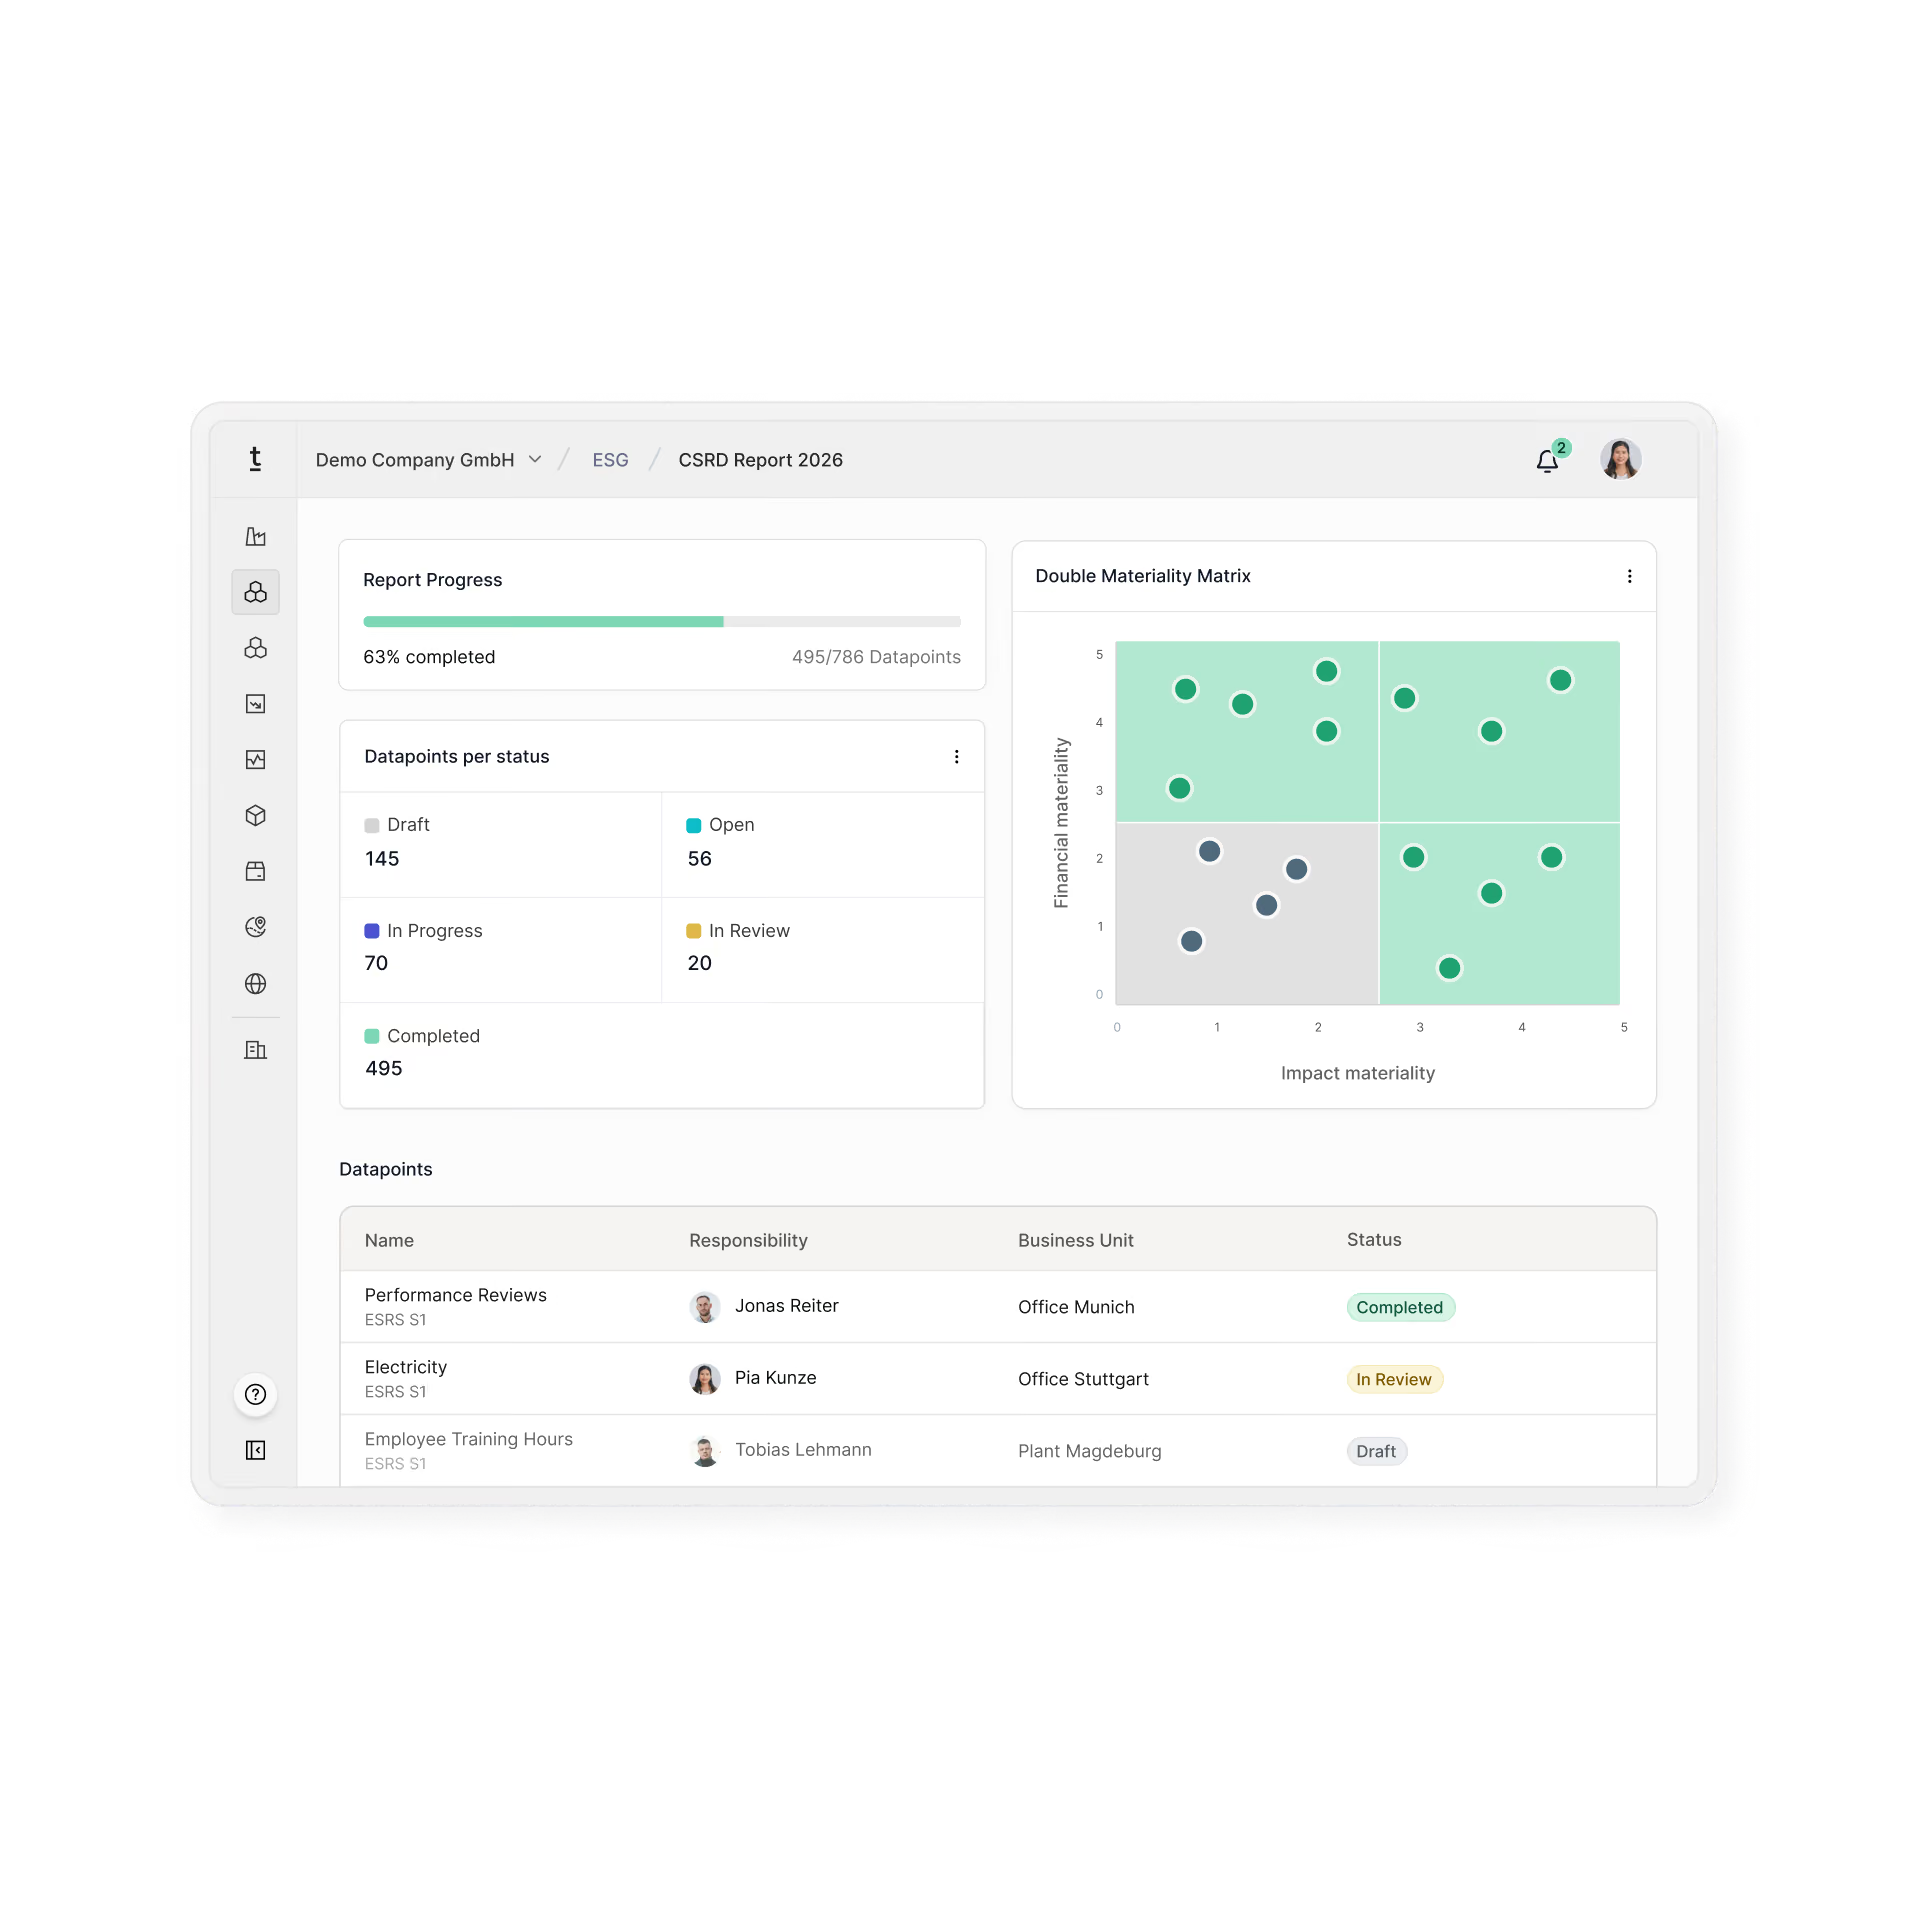
A digital, audit-ready standard process for mandatory CSRD reporting
Central governance dashboard for tasks and deadlines, decentralized data collection with automatic aggregation
Integrated audit trail with multi-level approval workflows and CSRD-compliant report generation with XBRL support
Dashboard der Demo Company GmbH für den ESG CSRD-Bericht 2026 mit Fortschrittsbalken, der 63 % Fertigstellung anzeigt, Status-Verteilung der Datenpunkte mit 145 Entwürfen, 56 offenen, 70 in Bearbeitung, 20 in Überprüfung und 495 abgeschlossenen Datenpunkten. Matrix der Doppel-Materialität zeigt Datenpunkte verteilt nach finanzieller und Wirkungsmaterialität. Tabelle listet Datenpunkte mit Name, Verantwortlichem und Geschäftseinheit sowie Status: Performance Reviews abgeschlossen, Electricity in Überprüfung, Employee Training Hours im Entwurf.

VSME

A pragmatic start for companies not subject to CSRD
Practical industry benchmarks and VSME-compliant reports
A harmonized data foundation you can later use for CSRD without switching systems
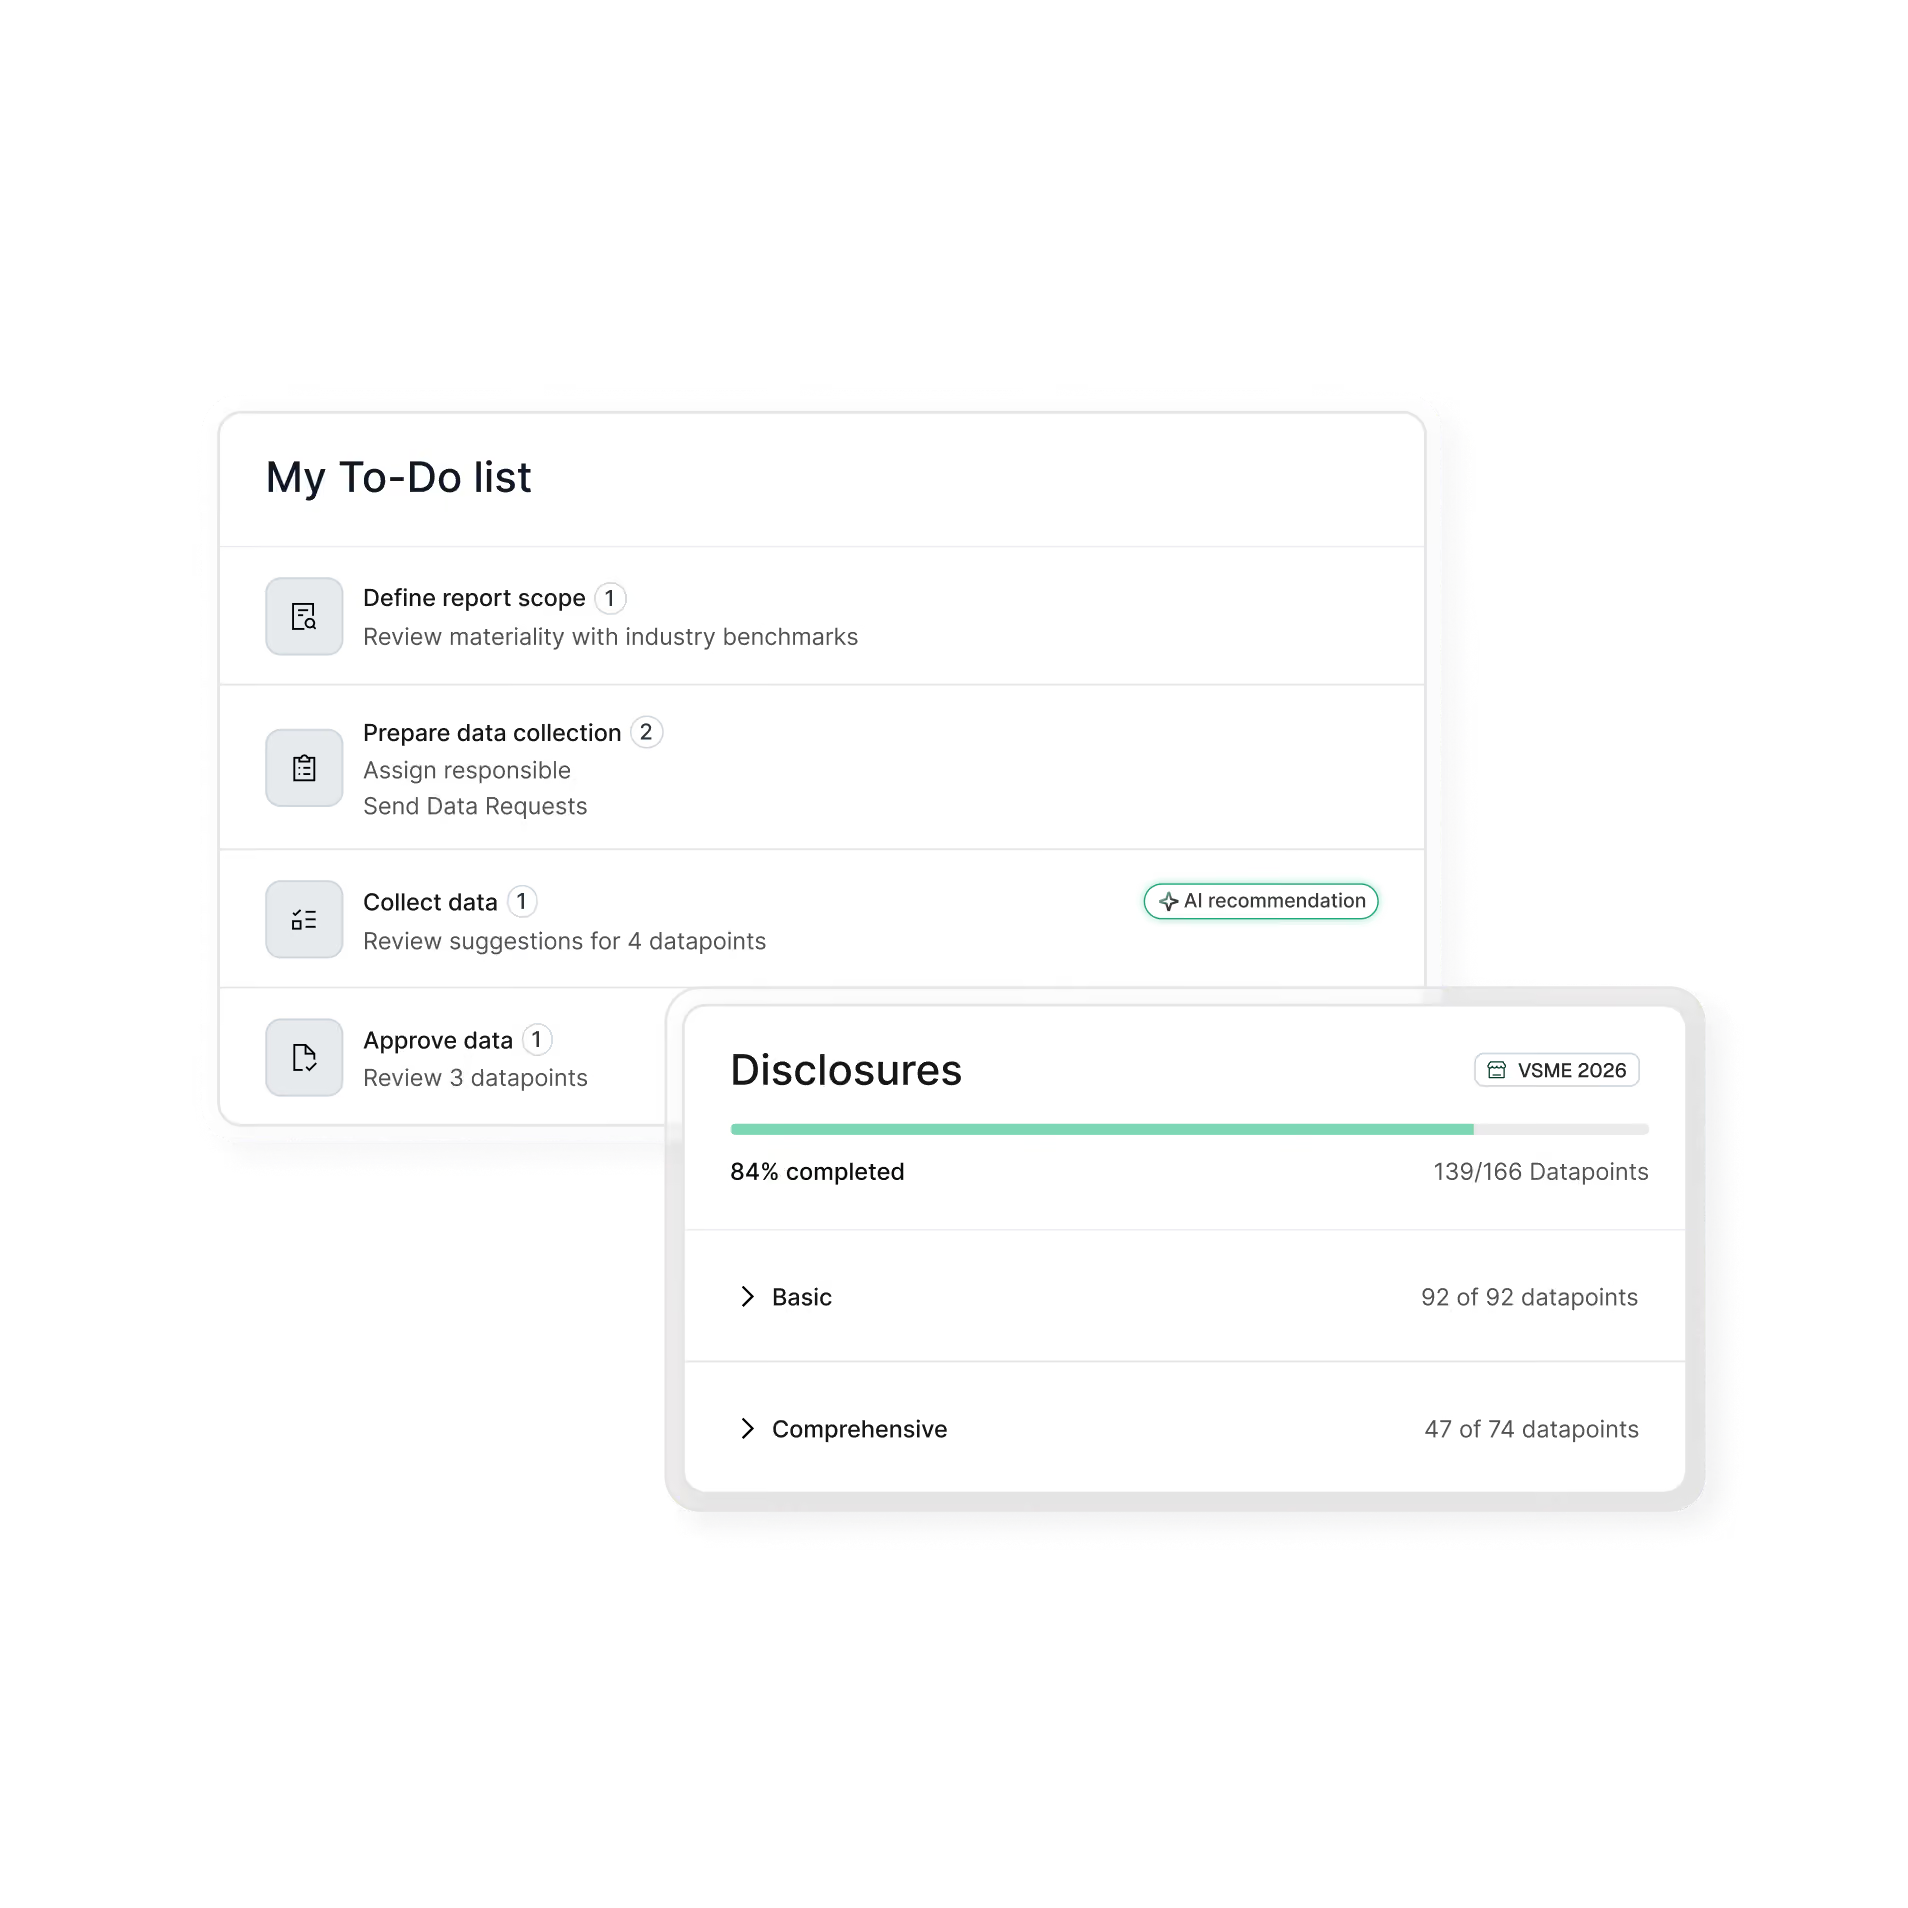
Zwei überlappende Abschnitte einer Software-Oberfläche: Oben eine To-Do-Liste mit vier Einträgen zur Berichterstellung, einschließlich einer KI-Empfehlung für die Datensammlung. Unten ein Fortschrittsbalken für Offenlegungen mit 84% abgeschlossen, 139 von 166 Datenpunkten, unterteilt in Basis (92 von 92) und umfassend (47 von 74) Datenpunkten.

EU Taxonomy

Seamless integration with CSRD
Assessment of taxonomy-eligible activities and review of substantial contribution criteria
Central evidence documentation and audit-ready reports
Dashboard der Demo Company GmbH zeigt ESG-Bericht für 2026 mit Fortschritt 63% bei 495 von 786 Datenpunkten. Zusammenfassung des Berichtsjahrs mit Umsatzerlösen von 48 Millionen Euro, Investitionsausgaben (CapEx) von 6,4 Millionen Euro und Betriebsausgaben (OpEx) von 4,7 Millionen Euro. Drei Tortendiagramme zeigen Aufteilung in angepasste, förderfähige und nicht förderfähige Beträge: Umsatz 42% angepasste, 43% förderfähige, 15% nicht; CapEx 38% angepasste, 35% förderfähige, 27% nicht; OpEx 48% angepasste, 30% förderfähige, 22% nicht. Beträge für nicht material, nicht förderfähig und förderfähig sind unter den Diagrammen aufgeführt.

Multi-reporting

Automated reporting across CSRD, VSME, EcoVadis, SAQ 5.0, and GRI
AI-based datapoint mapping between standards
Synergies between standards prevent duplicate data collection
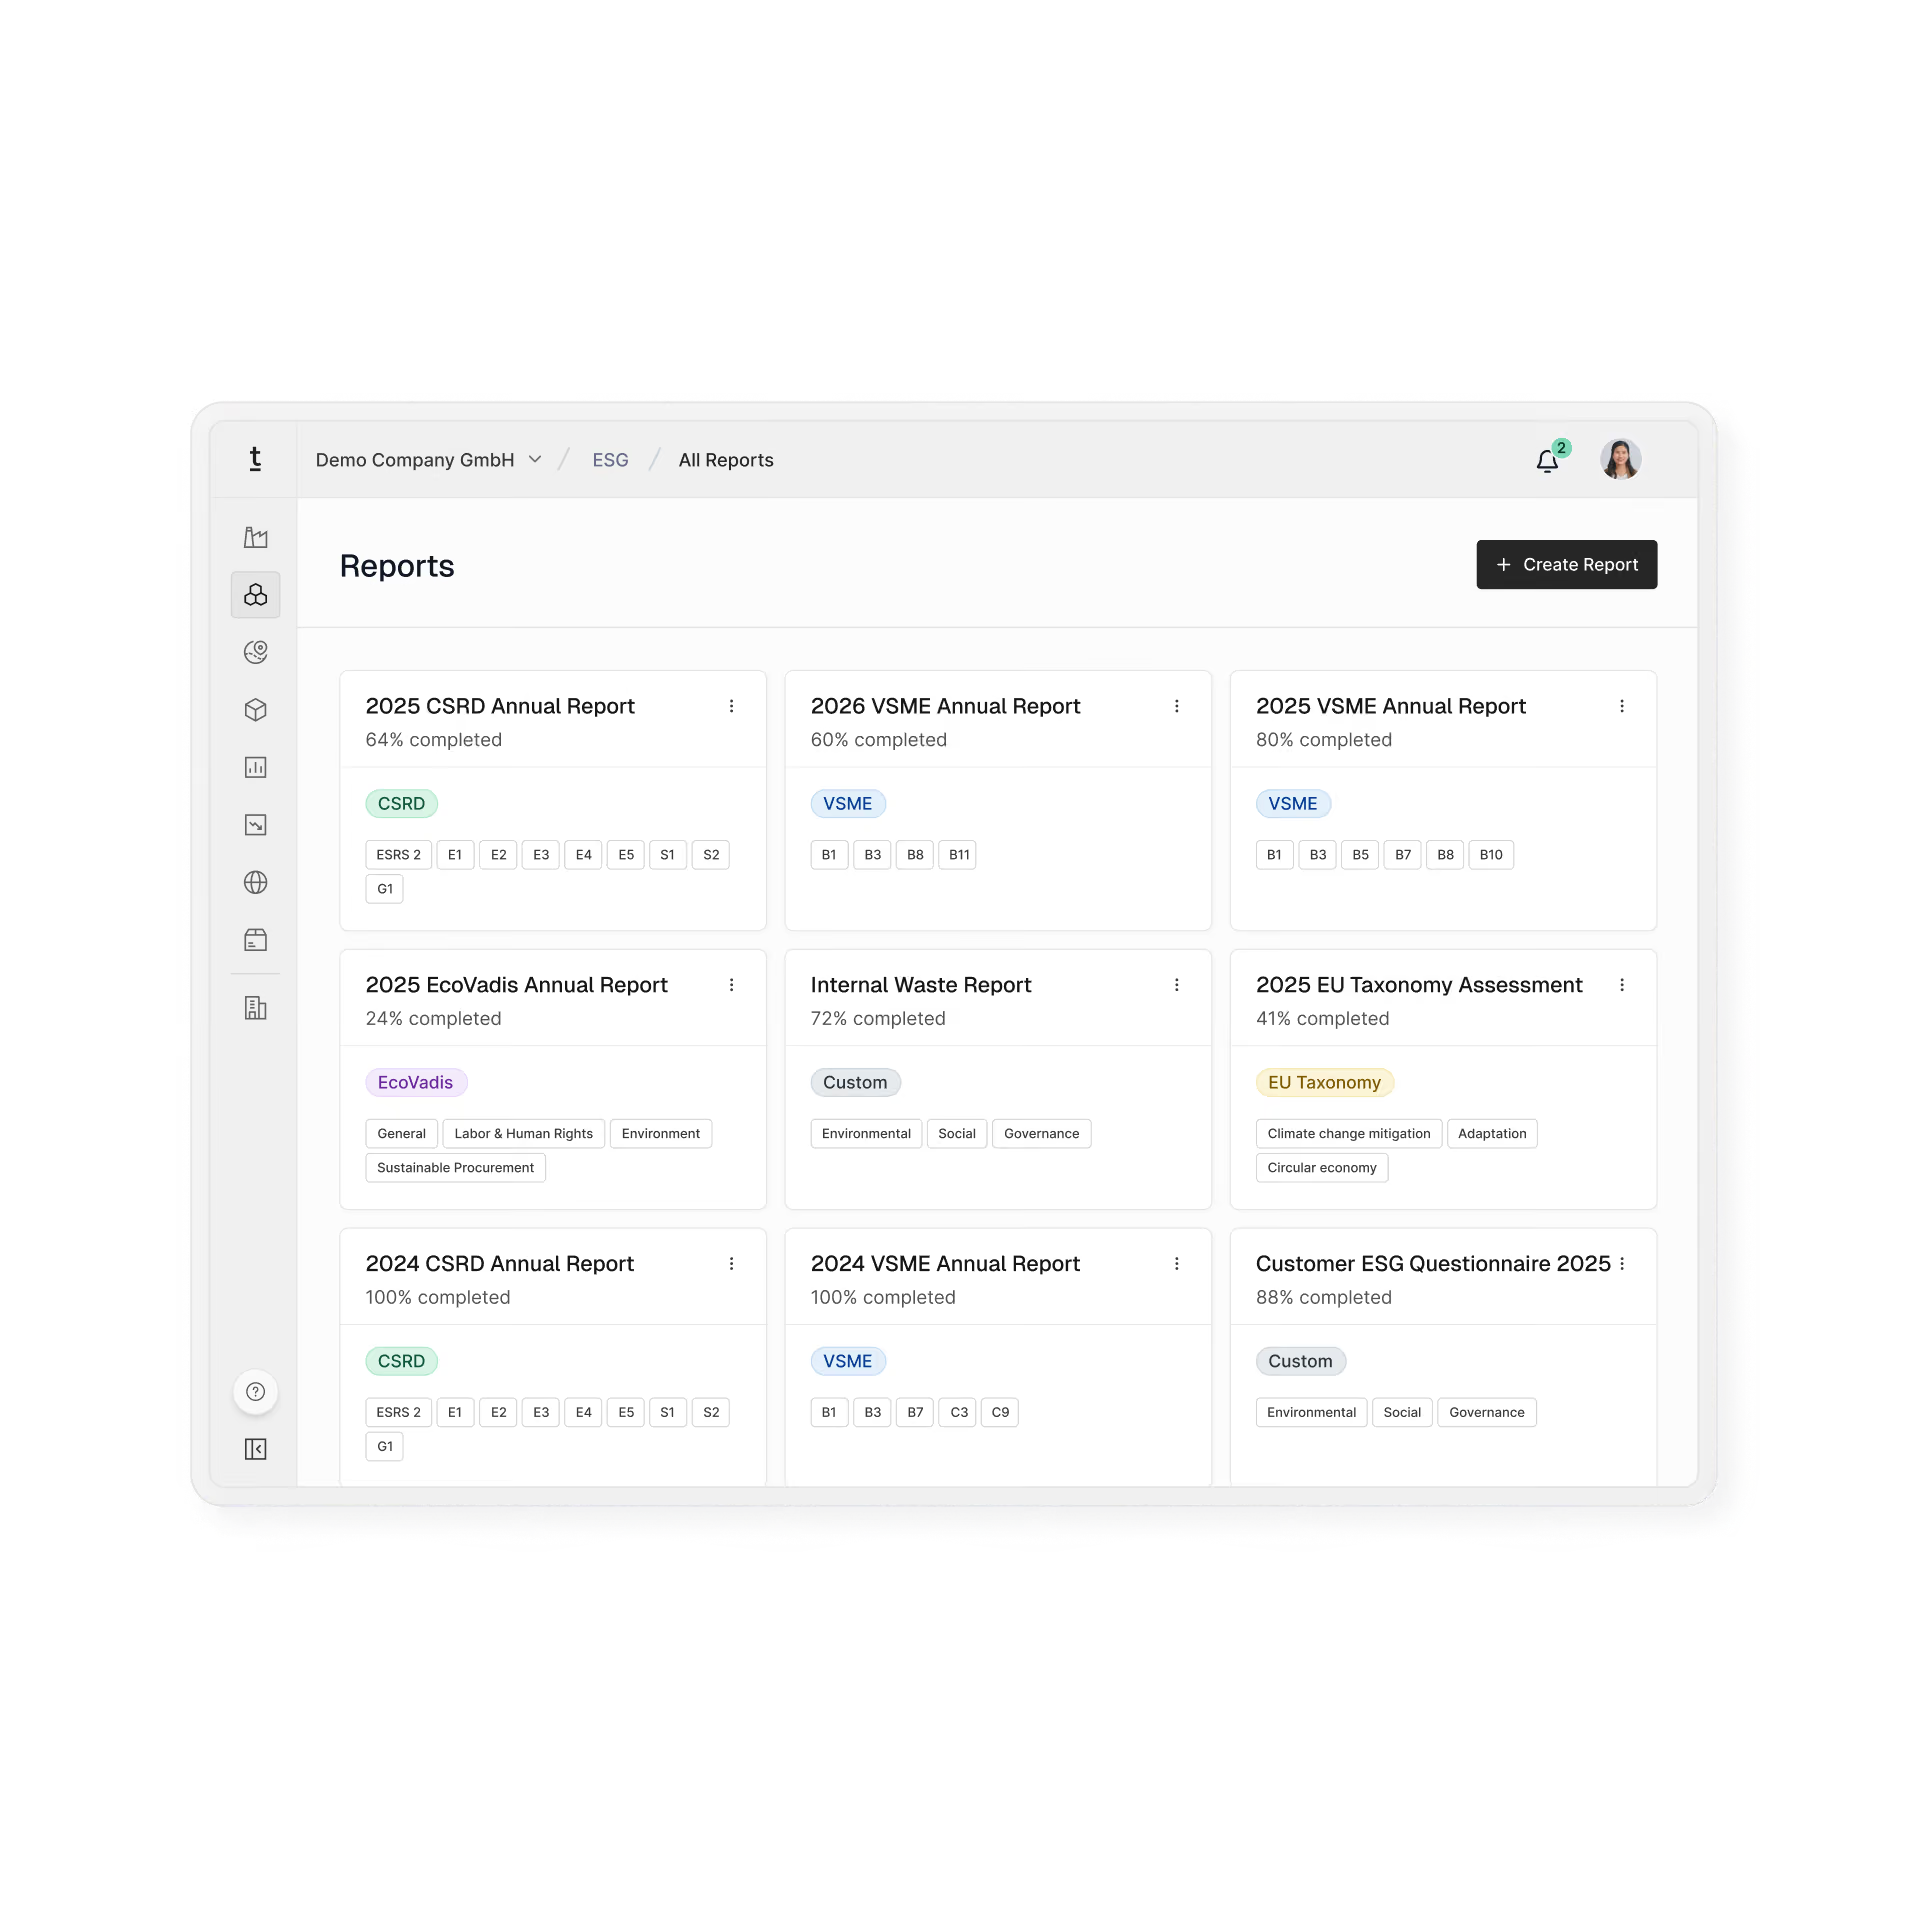
Dashboard der Demo Company GmbH zeigt verschiedene ESG-Berichte mit Fortschrittsanzeigen wie 64% des CSRD Jahresberichts 2025, 60% des VSME Jahresberichts 2026 und 100% des CSRD Jahresberichts 2024; Berichte sind kategorisiert nach Typen wie CSRD, VSME, EcoVadis, EU Taxonomie und benutzerdefiniert mit Tags zu Themen wie Umwelt, Soziales und Governance. Oben rechts ist ein Button "Bericht erstellen" sichtbar.

DMA

The first step in any CSRD or VSME reporting: it defines your actual reporting scope
Industry-specific IRO generator and configurable scoring scheme with threshold
Automatic derivation of reportable ESRS datapoints and an exportable materiality matrix for your management report and audit
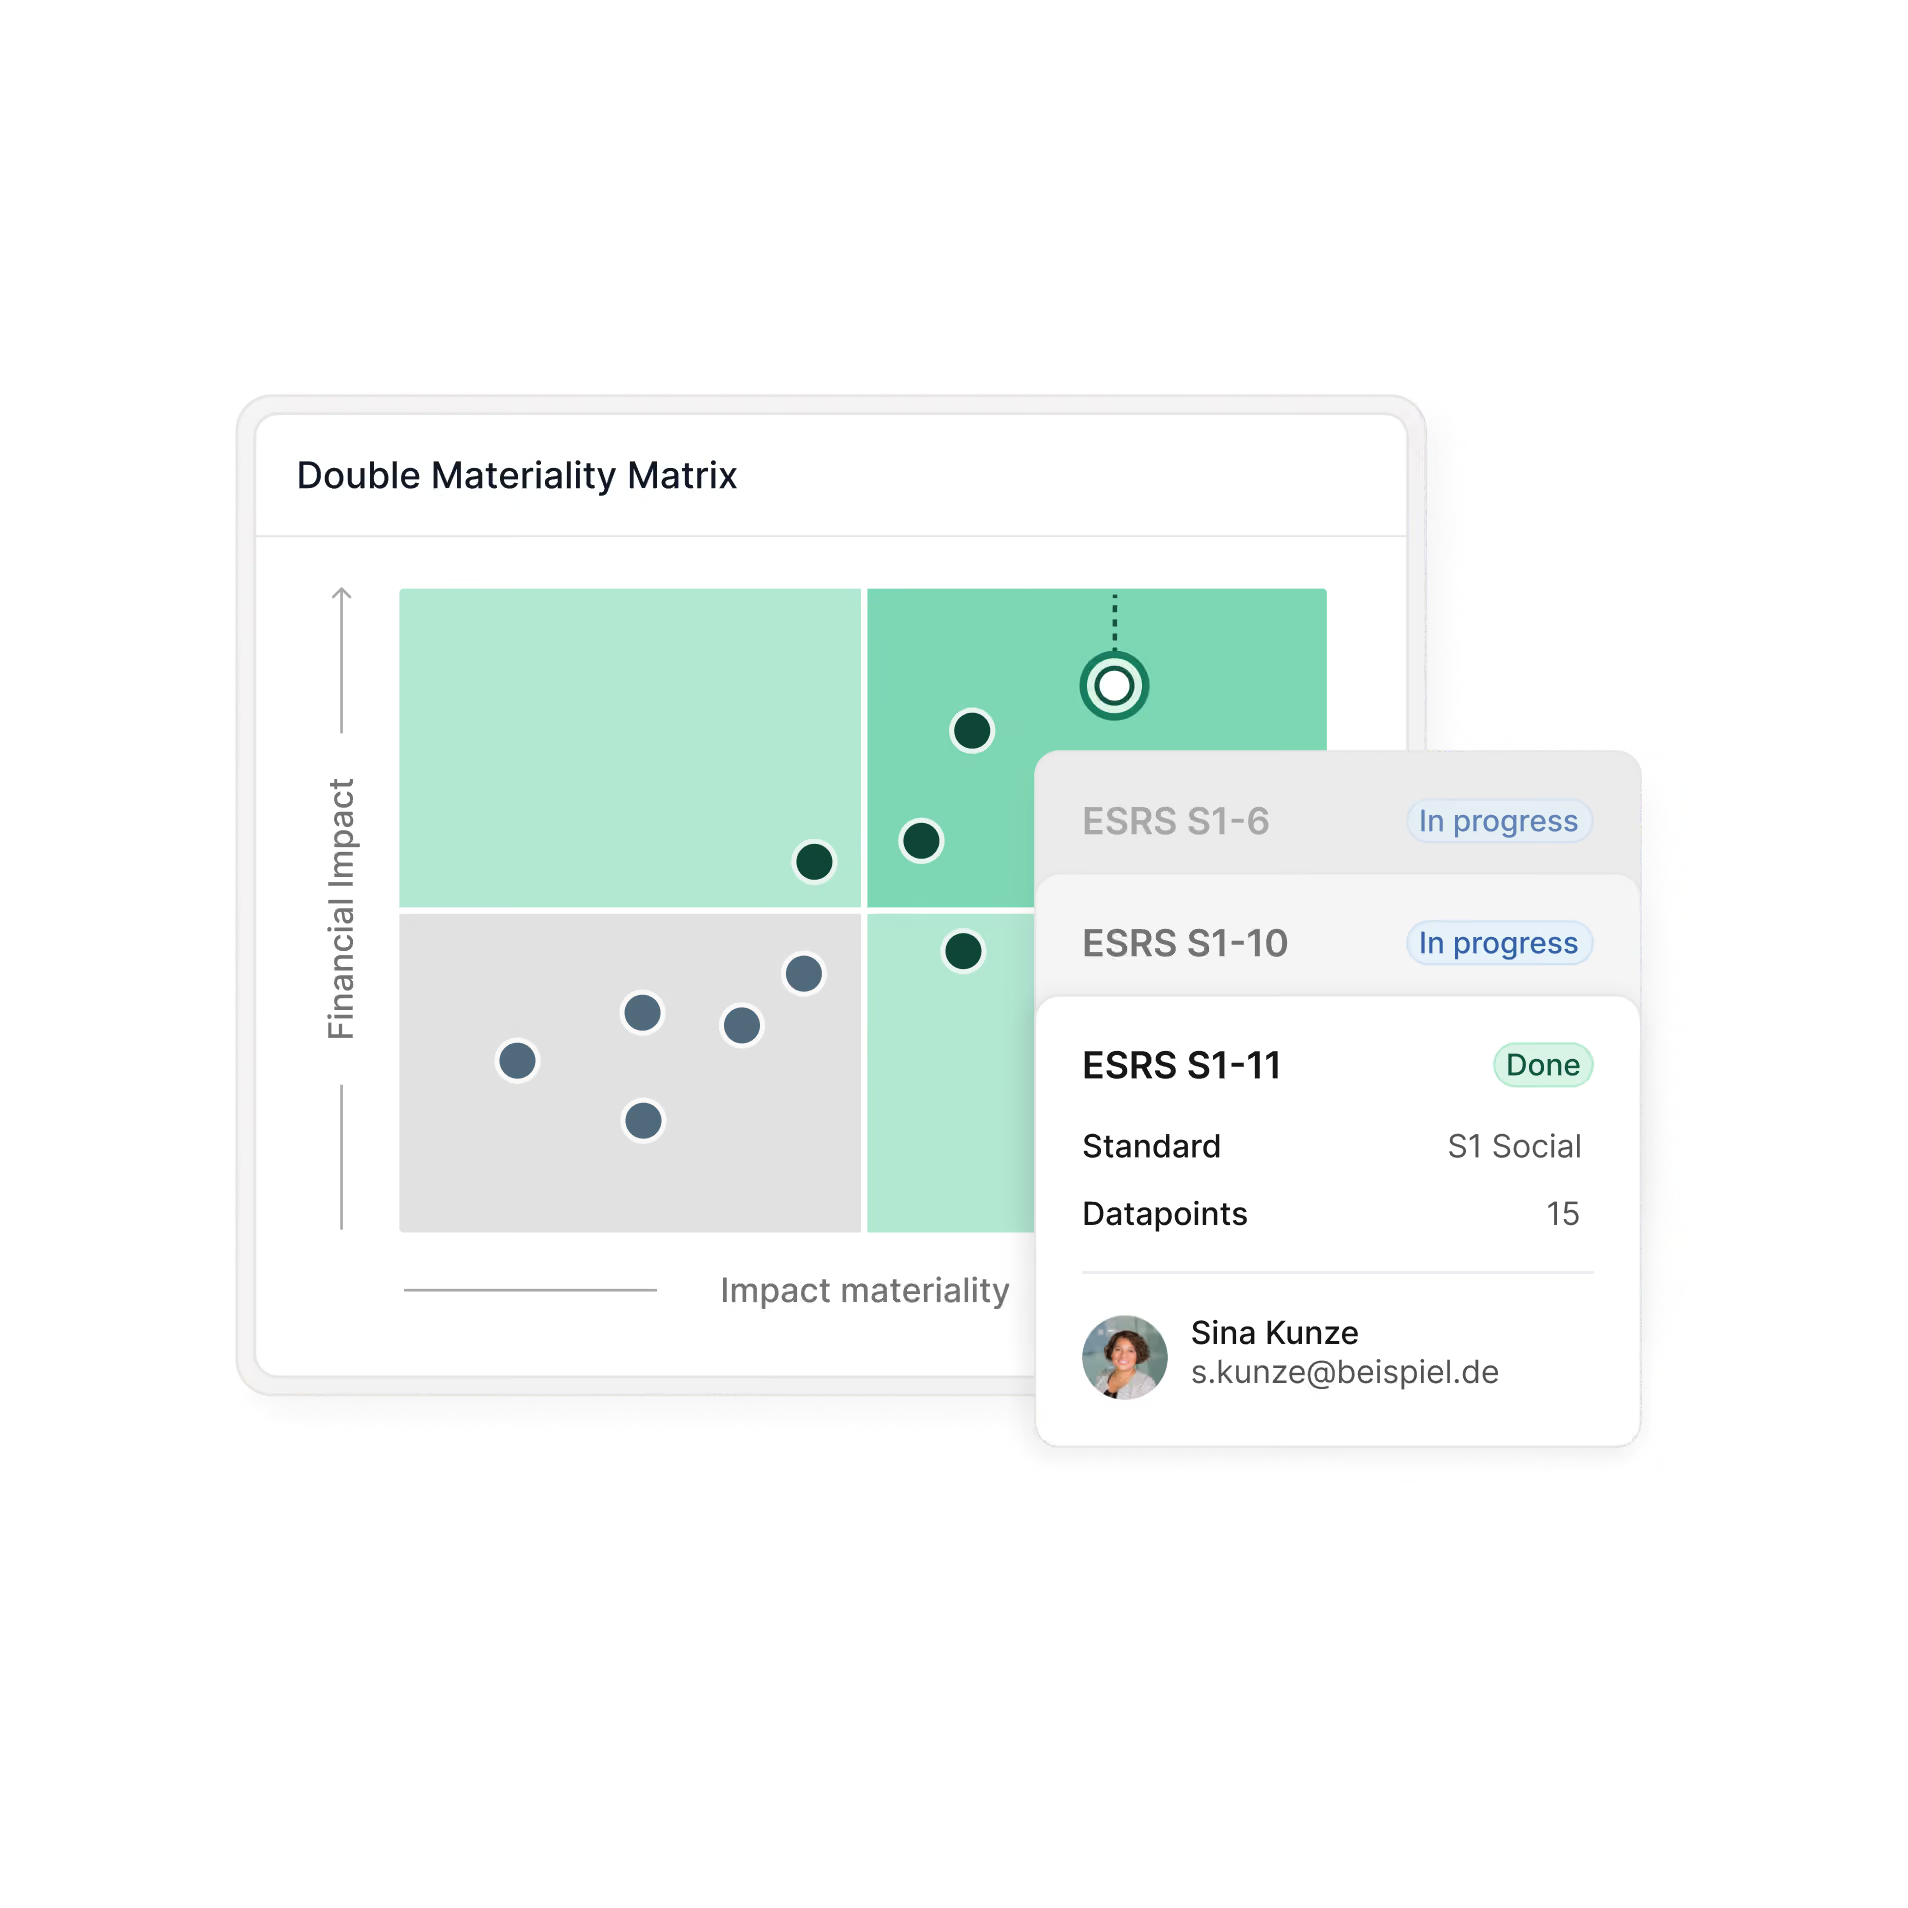
Doppelte Materialitätsmatrix mit Achsen Finanzielle Auswirkung (vertikal) und Wirkungsrelevanz (horizontal), Punkte in verschiedenen Quadranten; daneben ein Overlay mit Statusanzeigen für ESRS S1-6 und S1-10 als "in Bearbeitung" und ESRS S1-11 als "abgeschlossen" mit Details: Standard S1 Social, 15 Datenpunkte und Kontaktinformation zu Sina Kunze.

Your ESG report in five steps

Step 1: Define KPIs and set your framework

Start from predefined templates (ESRS, VSME, rating frameworks) or your own KPIs. If you are subject to CSRD, you begin with the AI-powered double materiality assessment.

Step 2: Set up data collection as a campaign

Assign responsibilities by site, department, or legal entity. Bundle data requests into one multilingual request per person and site. Set the frequency (monthly, quarterly, annually).

Step 3: Map datapoints with AI

Tanso automatically maps collected data to the relevant ESRS datapoints and reporting standards. Synergies between standards become visible, and duplicate data collection disappears.

Step 4: Calculate, analyze, and use KPIs internally

Generate report-ready KPIs with AI, visualize them at every level of your organization, and aggregate them freely over time and dimensions. Reduction potential and progress become verifiable, internally and externally.

Step 5: Create and publish reports

CSRD reports with XBRL tagging for digital submission, VSME reports in various export formats, rating responses in customer formats. Approval workflows and an audit trail make every report audit-ready.

More ESG reporting resources

Talk to our ESG experts.

In a live session, we'll show you:
Your specific use cases: CSRD, VSME, multi-reporting, or EU Taxonomy
A live demo of the platform with examples from your industry
How Tanso fits into your existing IT landscape (SAP, ERP)
Blaues Quadrat mit weißem ISO-Logo: stilisierte Weltkugel und ISO-Schriftzug oben rechts
ISO/IEC 27001
Abstraktes, zweifarbiges Icon: oben roter, unten goldgelber horizontaler Halbkreis, klare Kanten, flache Darstellung
Developed & hosted in Germany
Request a consultation
Türkisfarbene, gepunktete Farbschicht verläuft diagonal über dunklen Hintergrund, wirkt wie digitaler Farbschleier

Frequently asked questions

How does Tanso fit into our existing IT landscape (SAP, ERP)?

Tanso is ERP and data lake compatible. You get started with structured CSV imports, and API integrations with SAP or other systems can follow later. No ERP overhaul required.

Can we transfer ESG data into our own analytics or BI systems (e.g. Snowflake)?

Yes. The underlying data structure is optimized for integration into existing IT landscapes. ESG data can be connected via interfaces to analytics, BI, and data warehouse systems such as Snowflake, so it does not end up in yet another silo.

Can we create structured rating responses (EcoVadis, CDP) from Tanso?

Yes. The Multi-Reporting module uses AI to map datapoints to the requirements of EcoVadis, SAQ 5.0, GRI, and CDP. You answer questionnaires from the same data foundation that also serves your CSRD or VSME report.

What is the difference between the CSRD and the VSME, and which path should I choose?

The CSRD is mandatory for larger companies and requires full ESRS governance with an audit. The VSME is a voluntary standard for companies without a CSRD obligation that still want to provide structured sustainability transparency to customers, ratings and capital markets. Tanso covers both paths, and you can switch between them without changing systems.

Which reporting standards does Tanso cover?

Tanso supports CSRD/ESRS, VSME, EU Taxonomy, EcoVadis, SAQ 5.0, GRI and CDP. You collect a datapoint once and use it across all relevant standards. For the CSRD, full ESRS coverage according to EFRAG is built in, with XBRL support for digital submission.

How does the double materiality assessment work in Tanso?

The DMA is guided by an AI-powered workflow with an industry-specific IRO generator. You receive suggestions for impacts, risks and opportunities from your industry, then assess and complete them in a structured process. Tanso automatically derives the relevant ESRS datapoints from the results.

How long does it take to create a CSRD report with Tanso?

The exact time depends on data maturity and the size of your organization. The most time-consuming step in the first reporting cycle is the double materiality assessment, which you can complete in a few weeks with the AI workflow in Tanso. From the second reporting cycle onward, customers benefit from 80% recurring time savings on average, because KPIs are managed centrally and reused across standards.

How audit-ready is reporting with Tanso?

An integrated audit trail documents every datapoint and every change. Multi-level approval workflows and dedicated auditor access make the report traceable. For CSRD reports, XBRL tagging is available for digital, machine-readable submission.

weißes Logo mit dem Schriftzug tanso auf schwarzem Hintergrund, abgerundete Kleinbuchstaben, modernes Logo.

Tanso is the ESG and carbon accounting software trusted by industrial companies across the DACH region to stay competitive and compliant.

700+ industrial companies trust Tanso
Stay in the loop

ESG and carbon updates from industrial practice, straight to your inbox.