


How to Report FLAG Emissions: SBTi Targets & GHG Protocol Guidance


Forestry, Land, and Agriculture (FLAG) emissions refer to greenhouse gases released from activities within agriculture, forestry, and other land-use sectors. These emissions arise from both direct and indirect transformations of land for the production of food, materials, and other goods. As sustainability standards continue to evolve, companies with land-intensive operations are increasingly required to measure, report, and reduce their FLAG emissions. This is guided by frameworks such as the Science Based Targets initiative (SBTi) FLAG Guidance and the upcoming GHG Protocol Land Sector and Removals Guidance (LSRG), which provide methodologies for accounting and mitigation of emissions related to land use and land-use change.
This guidance from Tanso is designed to help companies understand:
- What FLAG emissions are
- Who is required to report on them
- How to disaggregate and measure FLAG vs. non-FLAG emissions
- What targets must be set
- Key timelines
1. What are FLAG emissions?
FLAG emissions refer to greenhouse gas (GHG) Emissions and removals arising from:
- Forestry – e.g., harvesting timber for construction or pulpwood for paper and packaging production.
- Land use and land-use change – e.g., deforestation, afforestation, and conversion of natural ecosystems for agriculture or urban development.
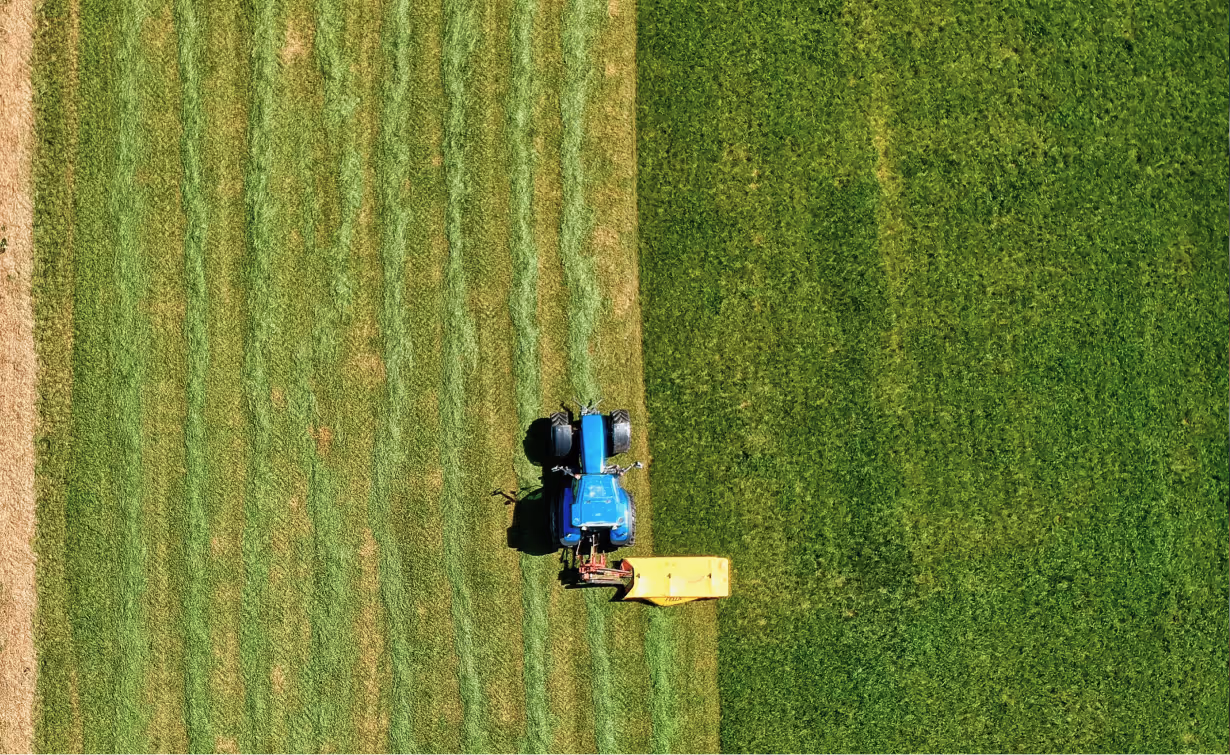
- Agricultural activities – e.g., livestock digestion (enteric fermentation), manure management, and fertilizer application.
- Land management practices – e.g., soil carbon sequestration, tillage practices, and crop rotation in croplands and pastures.
These activities result in either emissions or removals that are biogenic in nature. In this context, biogenic refers to greenhouse gas fluxes that originate from biological processes, such as plant growth and decay, soil carbon changes, land-use change, and biomass combustion. Unlike fossil emissions, biogenic emissions and removals are part of the natural carbon cycle, but they still contribute significantly to climate change when not properly balanced or managed.
Examples of FLAG emissions
- Methane from cattle (enteric fermentation)
- Nitrous oxide from nitrogen fertilizer
- CO₂ from deforestation
- CO₂ sequestration from reforestation or soil carbon build-up
2. Who needs to report FLAG emissions?
Per SBTi’s FLAG Guidance, companies are required to set separate FLAG targets if they meet either of the following criteria:
- >20% of total emissions are FLAG-related
- >20% of total revenue is generated from FLAG-affectedsectors
Affected sectors
- Agriculture and aquaculture
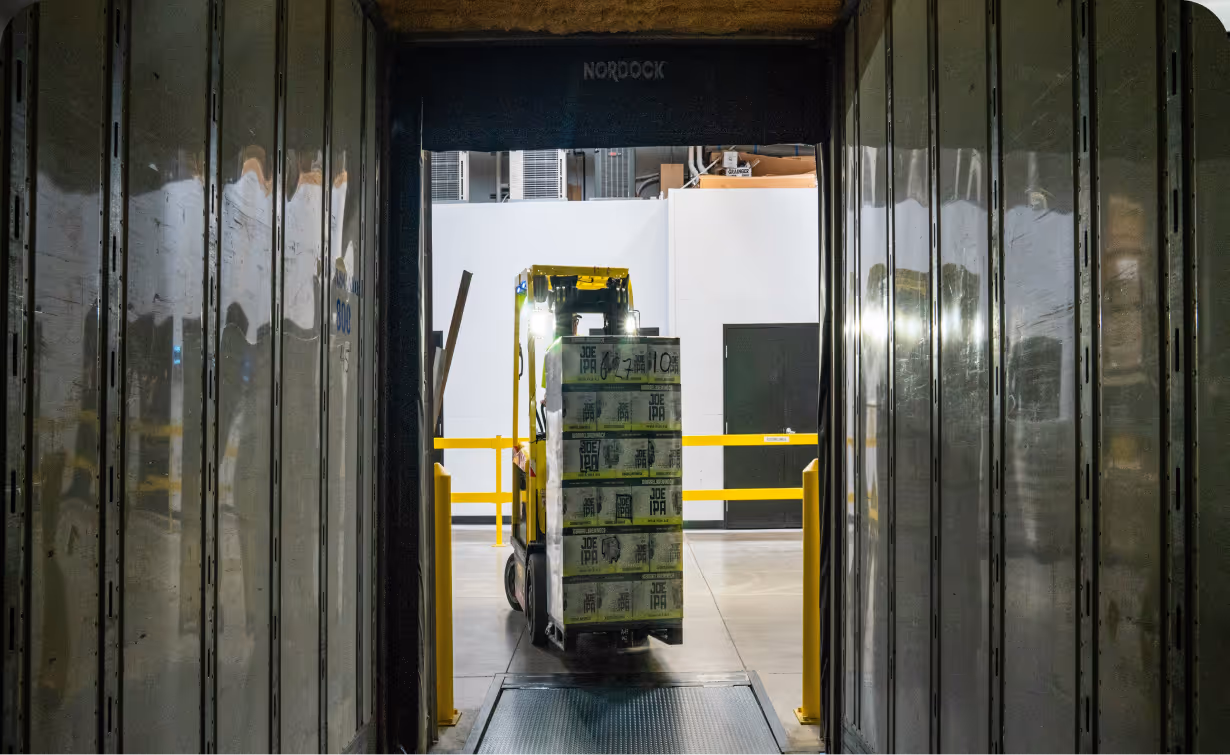
- Food and beverage
- Forestry and timber
- Apparel and textiles (natural fibers)
- Paper and packaging
- Retailers with private-label food or agri-products
3. Key concepts from GHG Protocol's LSRG
a) Land-Use Change (LUC)
Definition: Land-use change (LUC) is an emission category within FLAG, and refers to the conversion of land from one designated category or use to another. This can be from forests to agriculture, grasslands to urban infrastructure, or wetlands to industrial zones.
Types of LUC
- Direct Land-Use Change (dLUC): Emissions measured from land-use change that occurs on land that is part of the organizational boundary.
- Statistical Land-Use Change (sLUC): Estimated emissions from land-use change using regional or national statistics rather than direct land tracking.
Reporting requirements
- Track emissions and removals from LUC separately
- Use standardized carbon stock values or direct measurements
- Report gross emissions from conversion and timing of emissions
b) Land Management (LM)
Definition: Land Management (LM) is an emission category within FLAG, and refers to the strategic practices and techniques applied to manage land resources sustainably without changing the fundamental classification or use of the land. This approach focuses on optimizing the land’s productivity while minimizing negative environmental impacts, improving soil health, and enhancing biodiversity.
Examples
- Switching to no-till or reduced tillage
- Cover cropping
- Reduced fertilizer application
- Rotational grazing or regenerative practices
Reporting requirements
- Annual tracking of emissions/removals
- Use region-specific emission factors
- Report net change in emissions or removals
c) Land tracking and representation
Definition: This is the method to identifying, categorizing, and monitoring land over time to assign accurate emissions and removals.
Examples
- A farmers cuts down a forest they own to make a grassland for cows. The area and amount of wood is noted as part of the annual emissions.
- Foresters keep track of the forest harvest and management practices as part of the annual carbon accounting for their business.
Reporting requirements
- Define land area, use, and geographic boundaries
- Apply land representation methods: parcel-based, stratified, or area-based
- Annual tracking of land-use change and land management
- Retain historical data for consistency and auditability
d) Removals accounting
Removals refer to the uptake and long-term storage of carbon dioxide (CO₂) from the atmosphere, reducing the concentration of greenhouse gases in the atmosphere. These include:
- Biogenic removals, typically achieved through photosynthesis and carbon sequestration in plants, trees, soils, and other biological systems. These are not offsets, but rather on-site or supply chain-based carbon fluxes that contribute to a company’s net emissions reductions under land-based climate strategies (e.g., regenerative agriculture, reforestation, or improved grazing).
- Technological and geological removals, which involve engineered or chemical processes such as Direct Air Carbon Capture and Storage (DACCS), Bioenergy with Carbon Capture and Storage (BECCS), carbon mineralization, or enhanced weathering, where CO₂ is permanently stored underground or converted into stable materials.
Reporting requirements
- Removals shall be accounted separately from emissions
- Only primary data shall be used to account for removals
4. Target-setting requirements (SBTi)
Companies required to address FLAG must:
- Set separate FLAG targets aligned with SBTi’s FLAG pathways
- Report gross reductions and carbon removals separately
- Avoid double-counting with existing non-FLAG targets
FLAG targets must be aligned with a 1.5°C climate scenario and reflect unique land-sector dynamics.
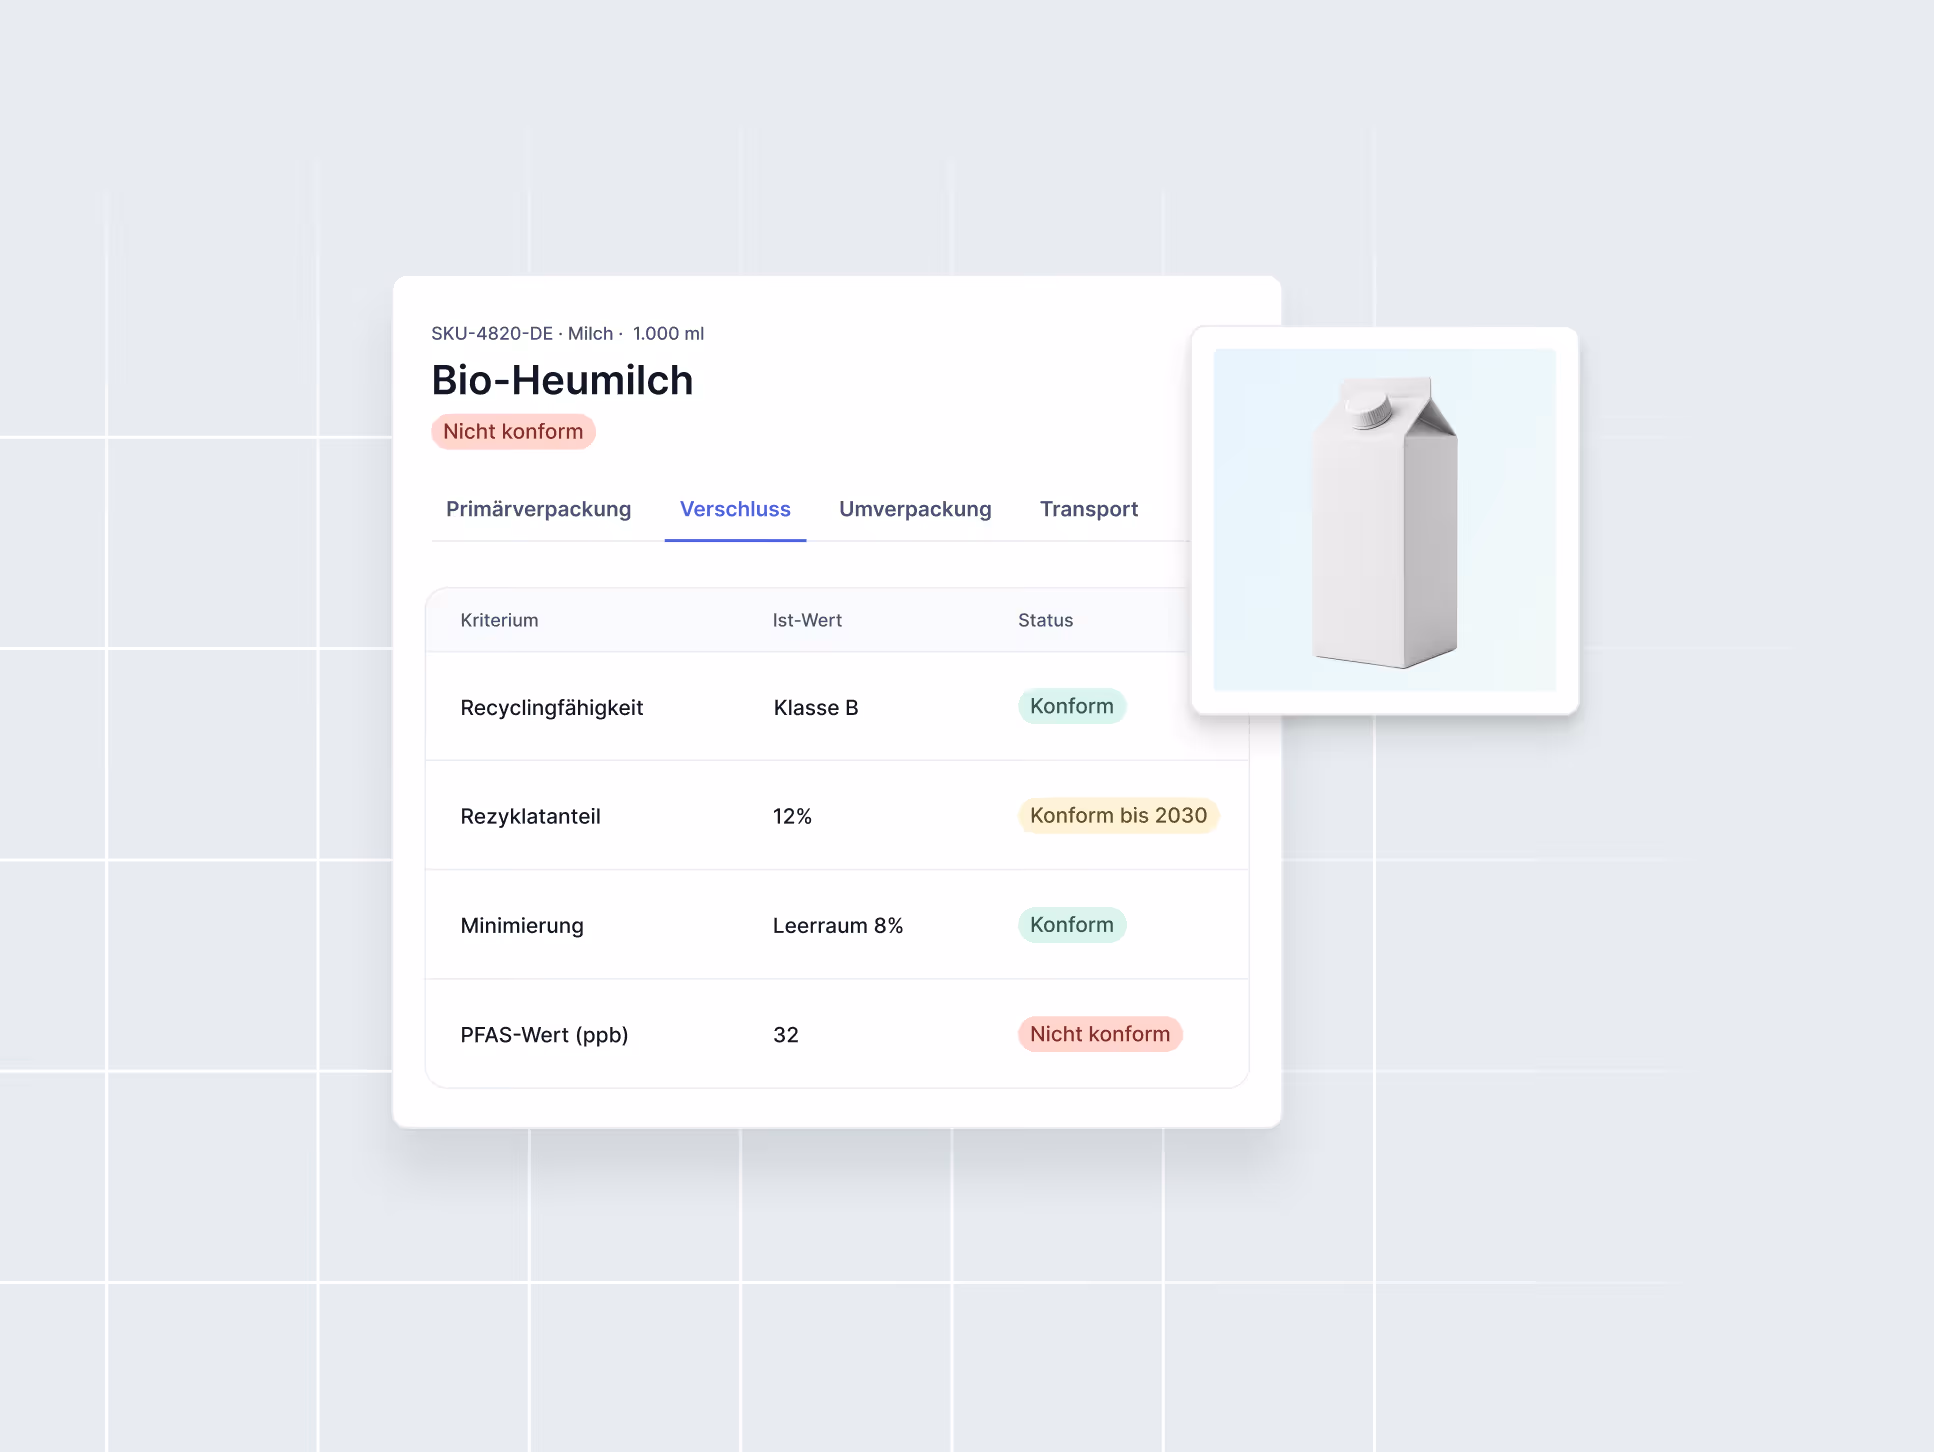
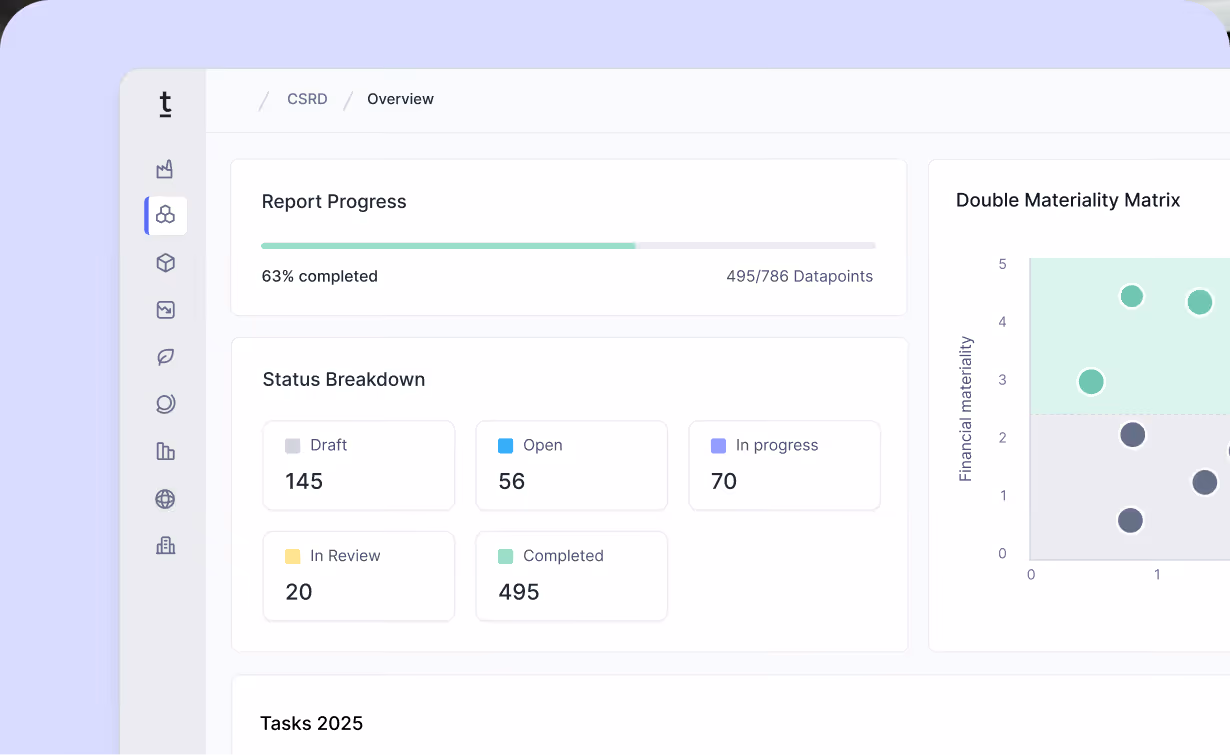
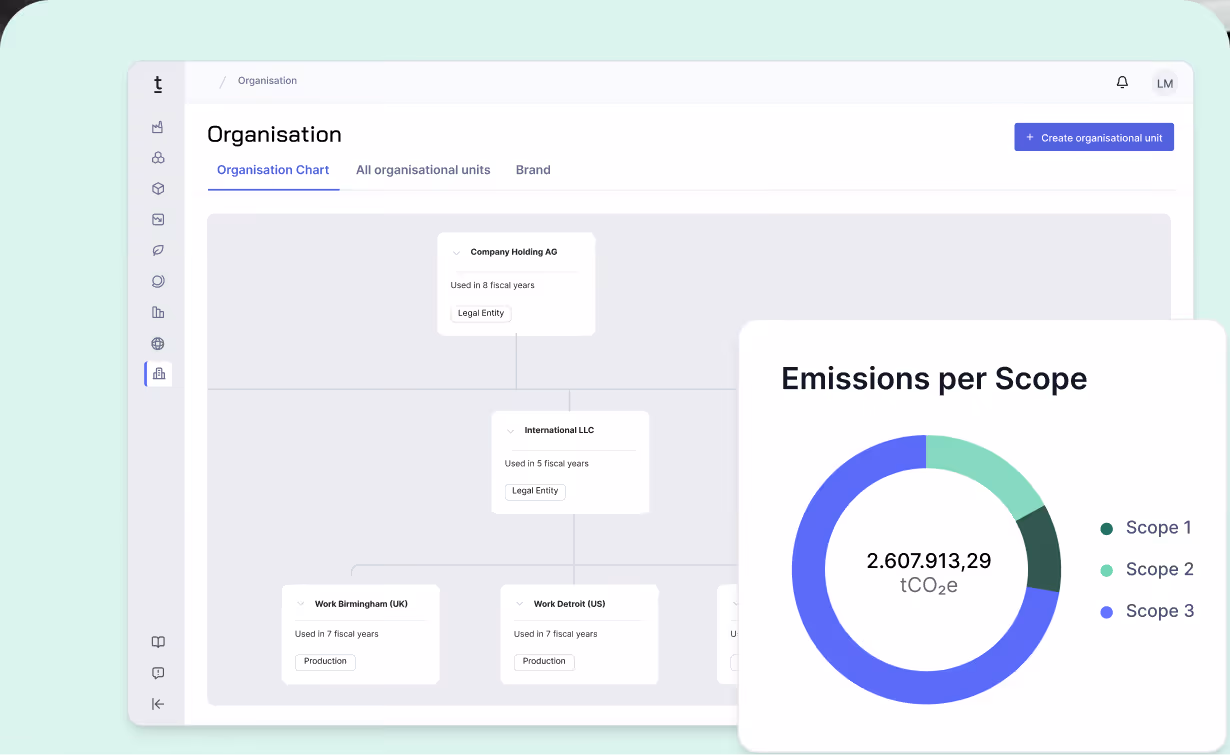
Example of real life application of FLAG reporting
Disclaimer: All values are only there as examples and do not reflect real emission values.
5. Timelines and upcoming milestones
6. How to prepare for FLAG reporting
Step 1: Assess FLAG materiality
Determine whether FLAG-related emissions or revenue exceed 20% of your total footprint.
Step 2: Map your value chain
Identify land-intensive inputs—e.g., raw materials, suppliers, or private-label brands tied to agriculture or forestry.
Step 3: Disaggregate emissions
Use internal systems or carbon accounting software (like Tanso) to separate FLAG vs. non-FLAG emissions, including carbon removals.
Step 4: Set FLAG targets
Use the SBTi FLAG pathways to:
- Set absolute reduction targets
- Report removals separately
- Exclude offset-based compensation
Step 5: Align with GHG Protocol
While the GHG Protocol's final Land Sector Guidance is due in 2025, draft versions are available for early adopters. Preparing early can reduce future compliance risks.
Step 6: Establish MRV (Monitoring, Reporting, Verification)
Use forrest/farm-level data, geospatial tools, or supplier surveys to improve data quality. Third-party verification is highly encouraged.
7. How can Tanso support in your FLAG reporting?
Tanso empowers companies to identify, quantify, and differentiate their FLAG and non-FLAG emissions and removals. We provide comprehensive guidance on how to collect high-quality primary data across supply chains to ensure accurate and credible accounting of land-sector emissions and removals in line with the GHG Protocol and SBTi FLAG Guidance. Where the collection of primary data is not feasible or cost-effective, Tanso offers robust secondary datasets that enable companies to reliably estimate their FLAG and non-FLAG emissions.


.avif)


.avif)
.jpg)


-p-800.webp.avif)
-min-p-800.webp.avif)
