Tanso Copilot – your digital colleague in sustainability

Benefit from comprehensive automation features and a system that learns continuously - becoming better over time.

Faster to your goal with focus on what truly matters

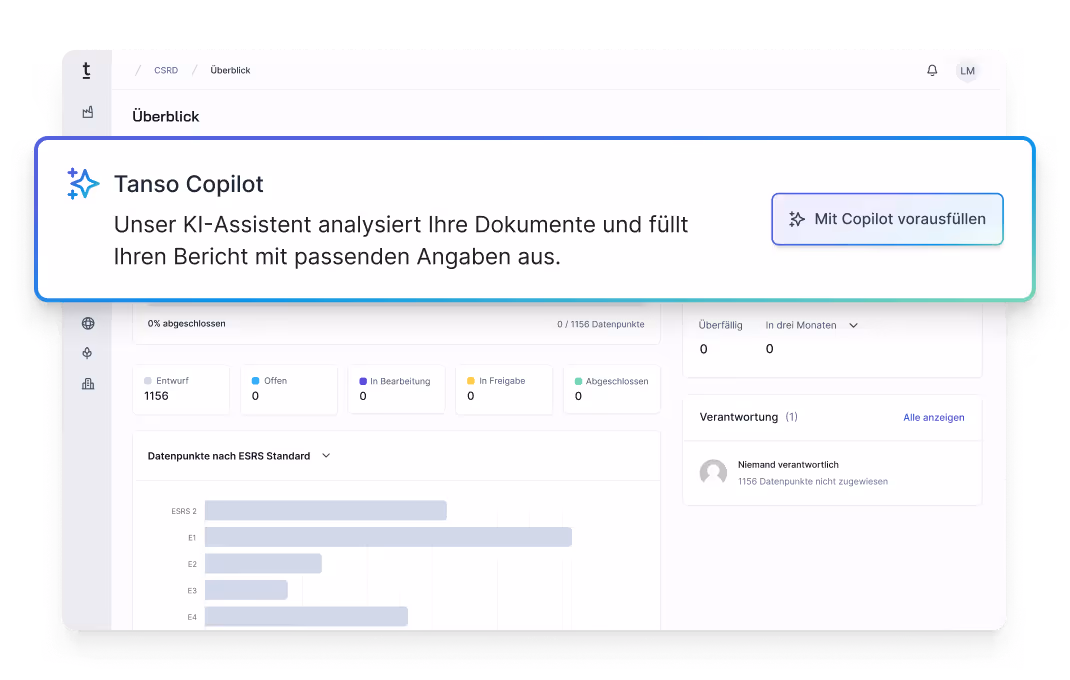
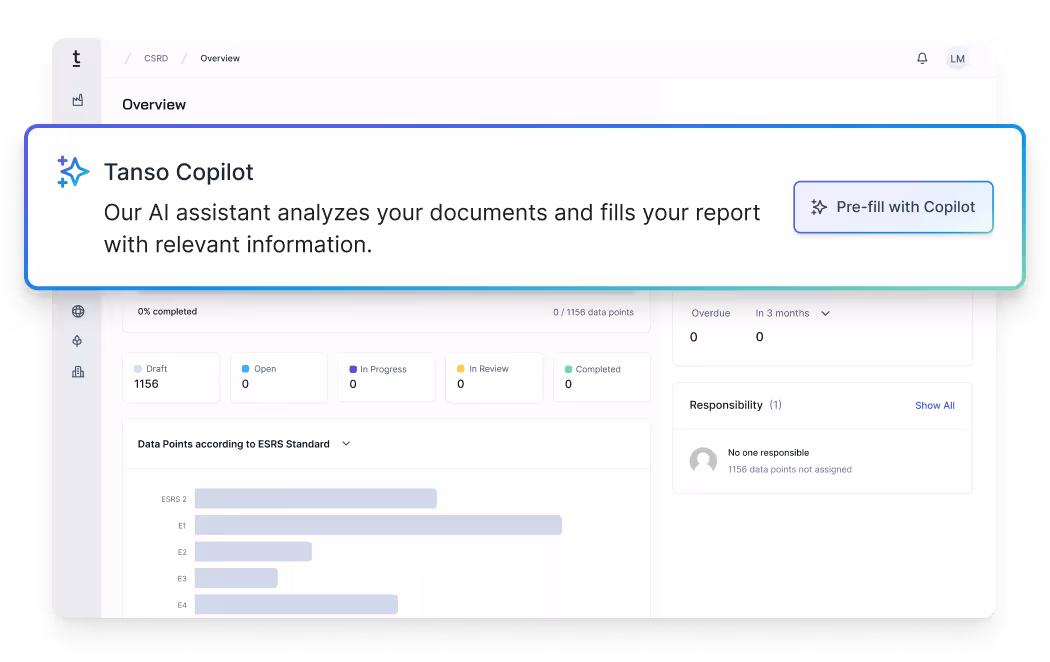
Copilot takes over recurring standard tasks and frees up resources across departments.

> 70% time savings

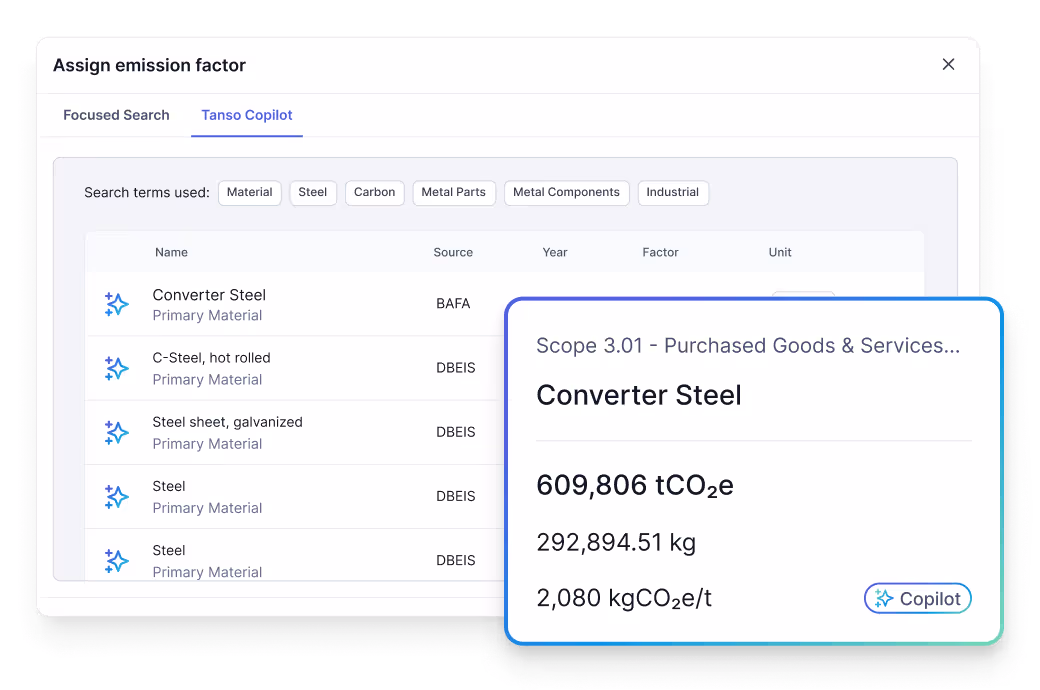
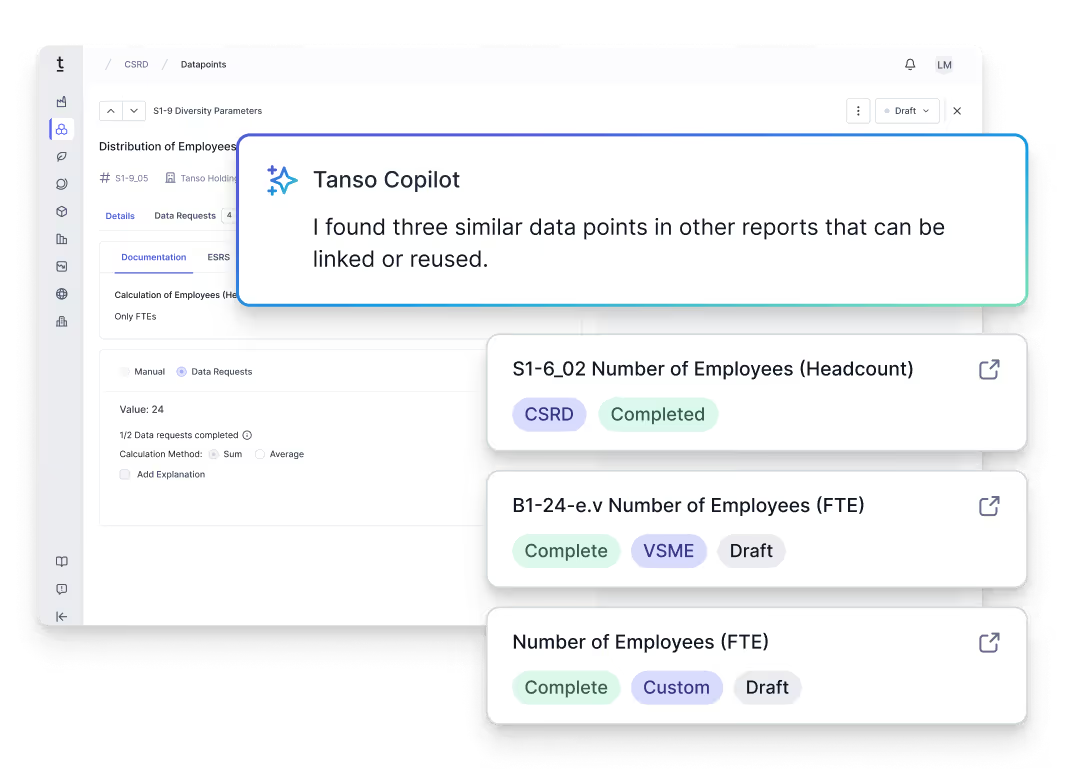
Tanso Copilot automates up to 70% of recurring tasks.

24/7 available

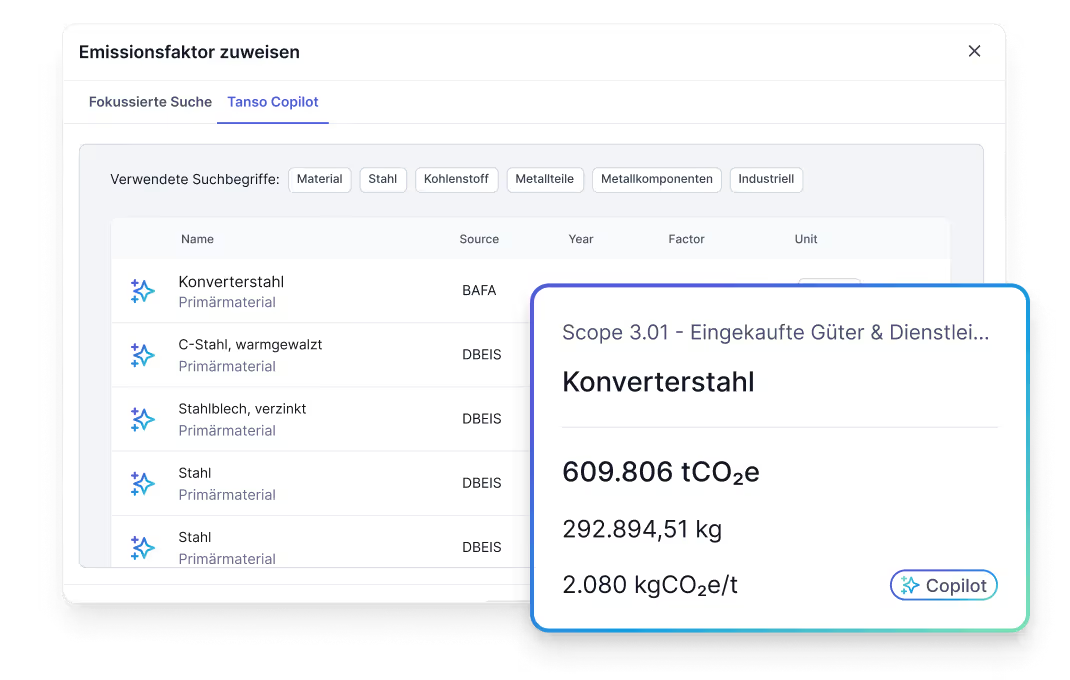
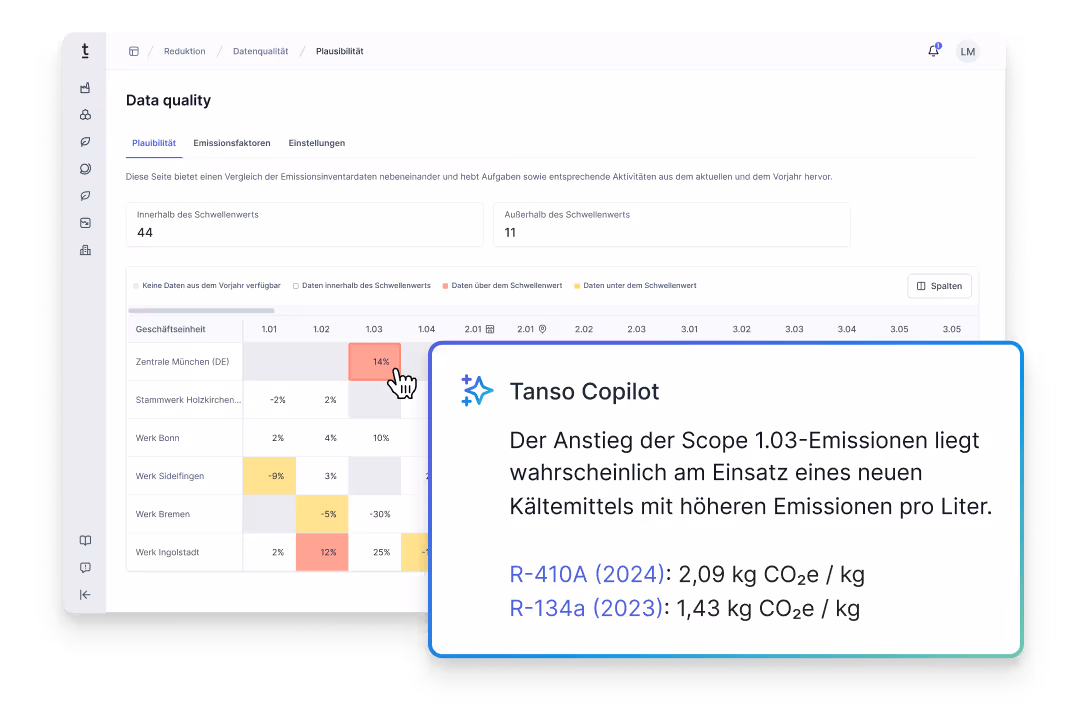
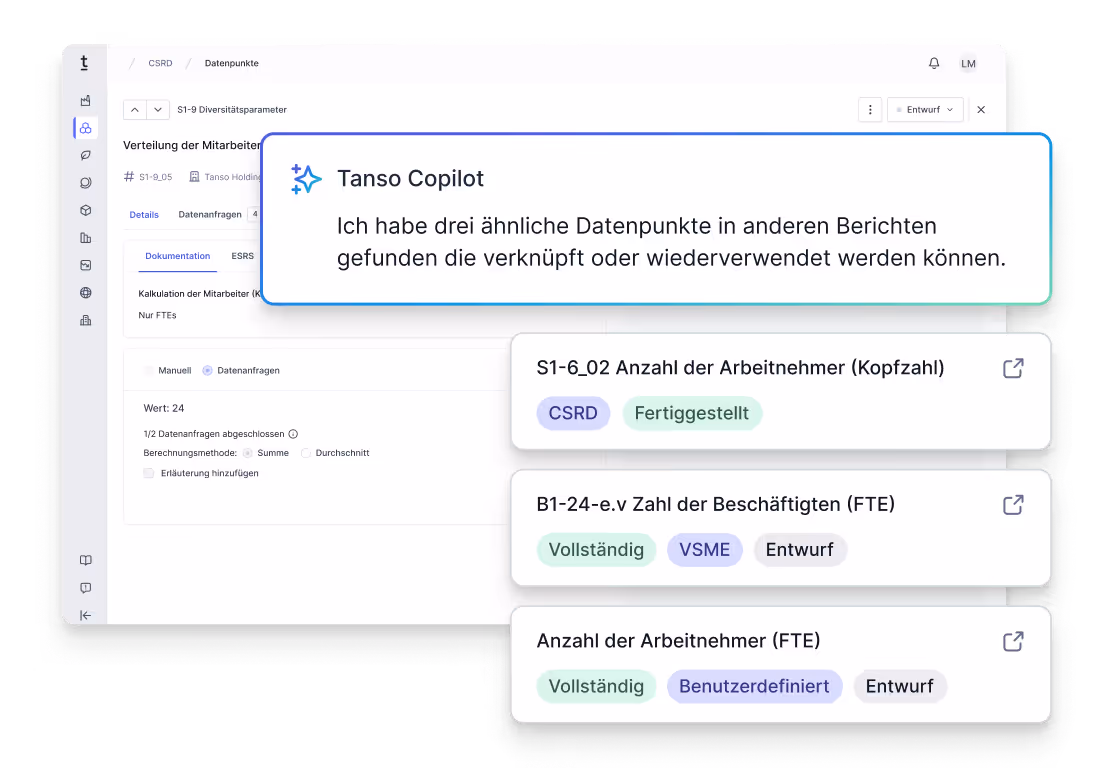
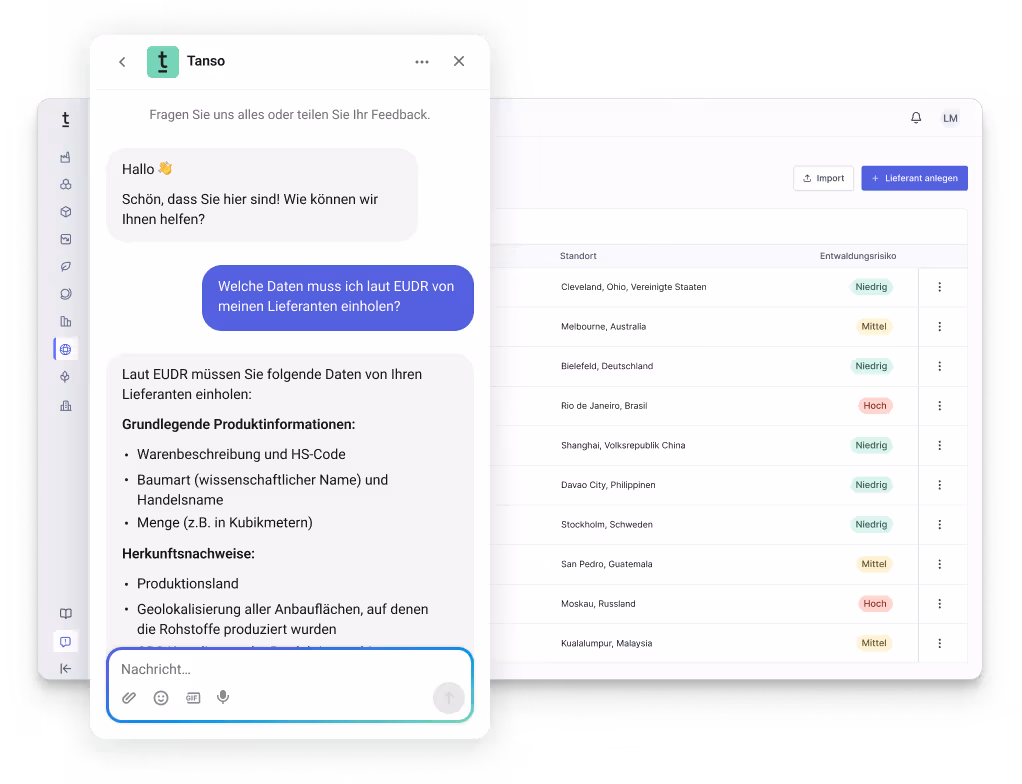
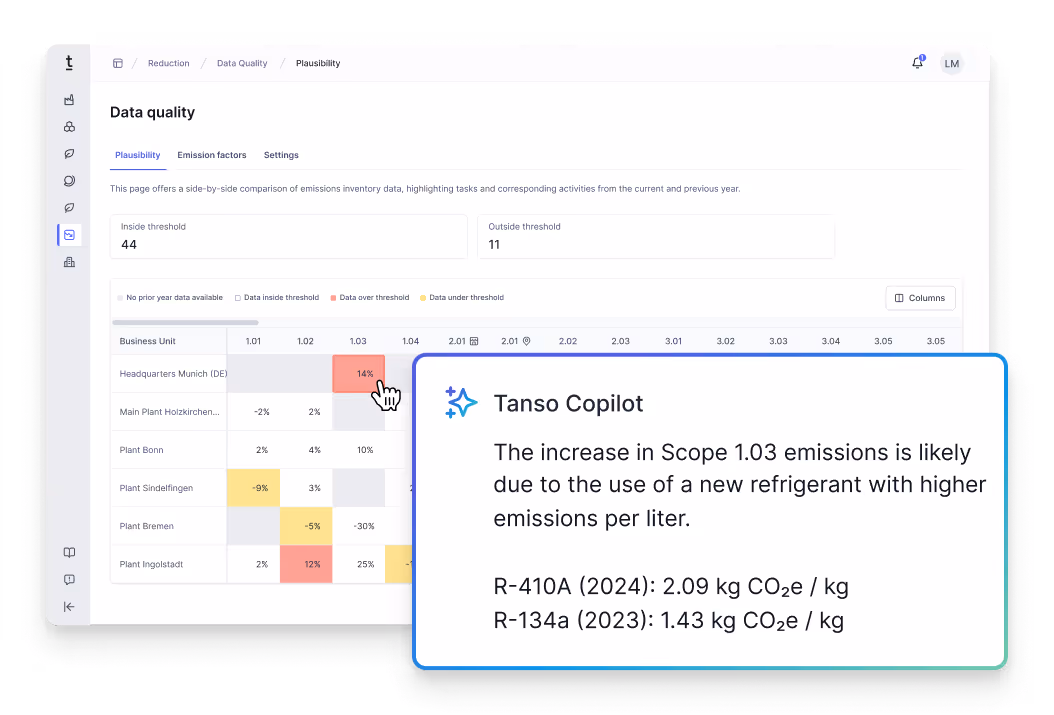
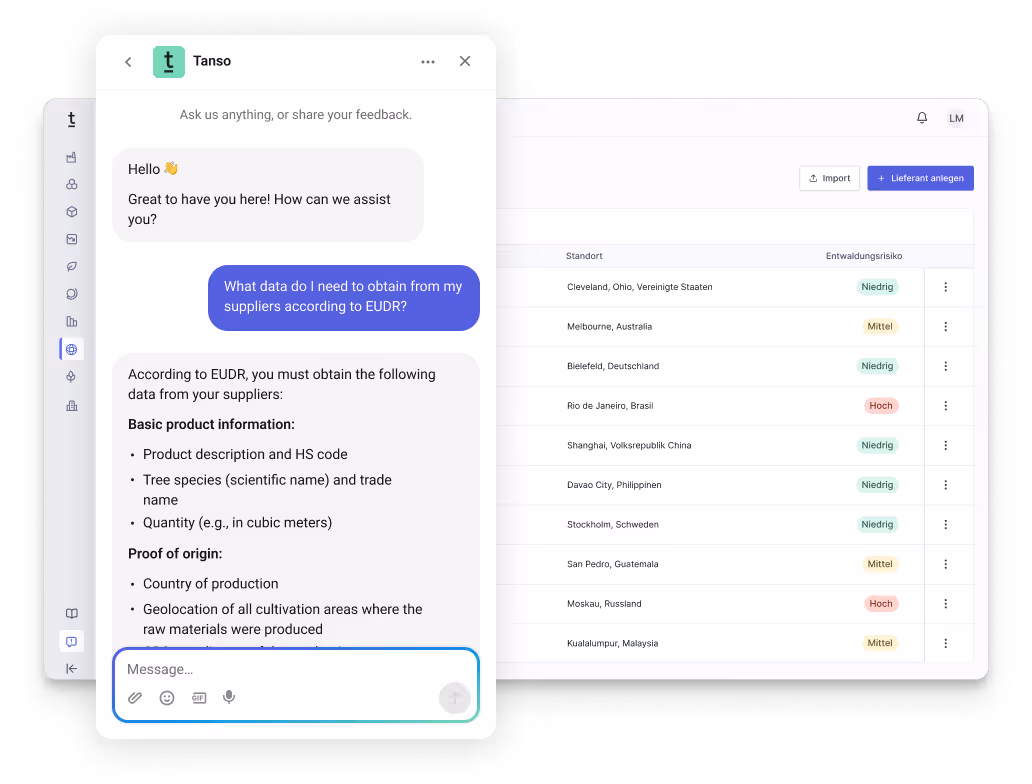
Tanso Copilot is always available to support you and deliver precise, context-specific answers.

100% security

Tanso Copilot ensures data protection and clearly indicates every use of AI.

Build a data foundation in minutes through document processing

  • Upload reports from previous years and benefit from automatic value transfer.
  • Use extensive features such as the IRO Assistant for a quick start to your accounting process.

Automated data management and document processing

  • Extraction and processing of various data types (PDF, Excel, system exports)
  • Automatic emission factor mapping, e.g., in Scope 3.1 and at the BOM level

Higher data quality and simplified audit preparation

  • Automated outlier detection for quality control
  • Insights into opportunities to improve your data quality

Avoiding duplicate work in reporting

  • Intelligent identification of cross-references between reporting standards
  • Efficient data point reuse for customer and stakeholder requests

Live chat - available in 30+ languages

  • Answering regulatory questions - trained on industry best practices
  • 24/7 availability for inquiries about the Tanso software and methodology
Übersicht der Aufgaben für 2024 zur Emissionsdatenerfassung in Kategorien wie Logistik und Strom, mit Statusupdates und der Möglichkeit, Vorlagen herunterzuladen oder Dateien via Drag & Drop hochzuladen.
Darstellung der CO₂-Emissionen von Elektrostahl mit Werkstoffnummer, Lieferanten-ID und Lebenszyklusphase, ergänzt durch ein Kreisdiagramm zu Emissionen per Scope und ein TÜV-Zertifizierungslabel.
Balkendiagramm zeigt Emissionen pro Werk (Shanghai, Geisingen, Kassel), während KPI-Karten die Emissionsintensität pro Mitarbeiter, Euro, kWh und m² mit Veränderungsraten anzeigen.
Balkendiagramm zur Emissionsreduktion durch Initiativen im Vergleich zu “Business as usual”, ergänzt durch Detailangaben zu einer E-Auto-Umstellung, einschließlich erwarteter Emissionsreduktion und Kosten.
Produkt Screenshots der Tanso CO2 Bilanzierungssoftware auf dem exportierbare CO2 Berichtserstattungen zu sehen sind.