Tanso raised €12M in Series A investment
Tanso raised €12M in Series A investment
Tanso raised €12M in Series A investment
Discover how we are working with industry leaders to redefine what sustainable business can mean for industrial companies.


"With the PCF created in Tanso, we efficiently meet growing customer demands for reliable sustainability data and gain a clear competitive advantage through verifiable data in tender processes. At the same time, the generated PCFs also enable us to fulfill contractually agreed customer requirements."


“With Tanso, we reliably and automatically collect the data relevant to our PCF. This reduces complexity, improves data quality, and enables us to respond to customer inquiries quickly and with confidence.”


“Tanso’s integrated emissions factor database helps us quickly find suitable factors – including for specific products like furniture thanks to ongoing updates. This saves research effort and provides a solid data foundation for reliable PCFs.”


”By combining CCF and CSRD in a single platform, Tanso creates clarity, leverages data synergies, and brings structure to complex sustainability processes.”

“Together with the executive management, we decided to use a tool for CO₂ balancing in order to map Scope 1 to 3 in a structured and comprehensible way. We chose Tanso - particularly because of its combination of automation, analysis functions, integrated database and high level of user-friendliness.”

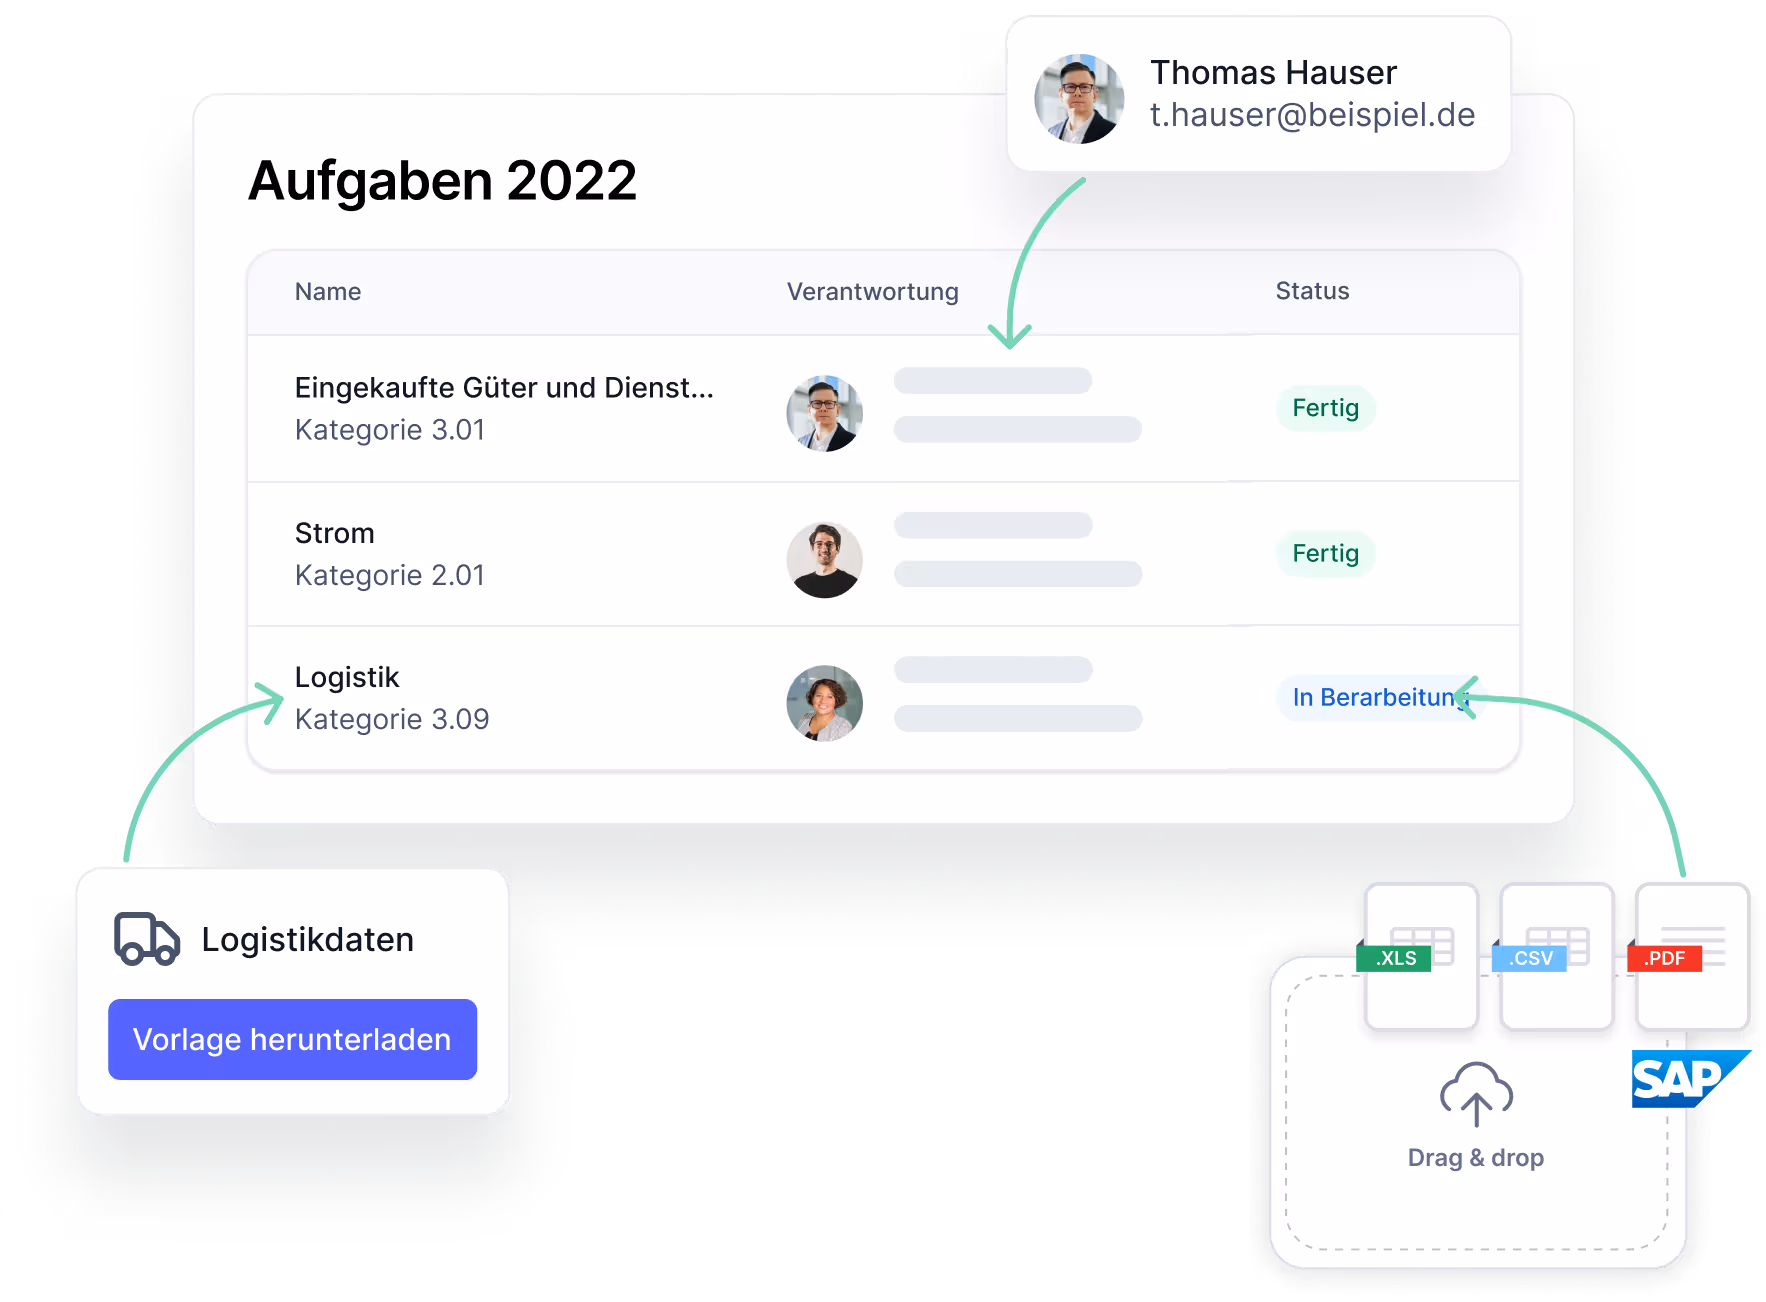
“The task management in Tanso is very user-friendly, and features like date control and approval status support us effectively. This allowed us to reduce the time needed for the creation of our first CCF by 30% and for the second CCF by 50%. The AI-powered text generation and the direct linking of ESRS standards are particularly helpful and significantly simplify the process.”

“The seamless integration of PCF and CCF data has significantly accelerated our processes – we’re now much faster and avoid redundant work. What used to take almost a full day is now done within a few hours. In addition, our customers also appreciate the quality and informative value of the PCF reports.”


“Our CSRD test report clearly highlighted how challenging it is to efficiently collect and prepare relevant data – a process that not only requires time but also close coordination within the company. One of the biggest challenges was identifying the right contacts worldwide and gathering financial and sustainability data in the required quality and format."


“Tanso provides us with a comprehensive software suite for carbon accounting and CSRD reporting. Thanks to its smart structure, the integration of existing data, and efficient workflow management, our effort has been significantly reduced. The clear interface greatly simplifies monitoring, and data collection, which previously required extensive spreadsheets, can now be completed within just a few hours.”

“As a medium-sized group of companies, Tanso enables Zambelli to set up a management system for non-financial KPIs in parallel with controlling. In addition to sustainability indicators and compliance, we can also record other topics and data points for quality and environmental management in Tanso in a structured way and use this data for our certifications and business decisions.”

Thanks to the Tanso software, we were able to independently complete the accounting for Scope 1 to 3 in just two months – a 75% time saving compared to the eight months required with external consultants.


“We are working with Tanso to implement the CSRD. The impressive development speed of Tanso software since the start of our collaboration is a great advantage for us. Especially because the EU/EFRAG has gradually specified the exact requirements, we are pleased to have a fast-acting partner at our side.”

“The import assistant in Tanso is the most helpful feature for me. It makes it much easier to process large amounts of data and allows me to save valuable time.”


“Together with Tanso, we want to combine data with machine learning to manage the transition to a low-carbon economy and meet increasing challenges in terms of transparency and verifiability.”

“Since the introduction of Tanso, our time spent calculating Scope 1 and 2 in the first inventory year has been reduced from two working days previously to just a few hours.”


“For us at FEP, it is particularly important to efficiently determine PCF calculations for product groups and product variants. In Tanso, simply duplicating and adapting the PCFs helps me. As a result, I was able to calculate multiple PCFs in a very short time.”

“As a company that requires CSRD reporting, Tanso's software has provided us with tremendous support, especially in the initial reporting phase. The integrated project management and a clear overview of all relevant data points have significantly simplified the process and optimized the quality and traceability of our reporting.”

“The direct integration of our auditors into the Tanso software ensures their active participation in CSRD reporting right from the start. As a result, we were able to enable seamless cooperation and ensure fully compliant reporting — without additional coordination loops.”


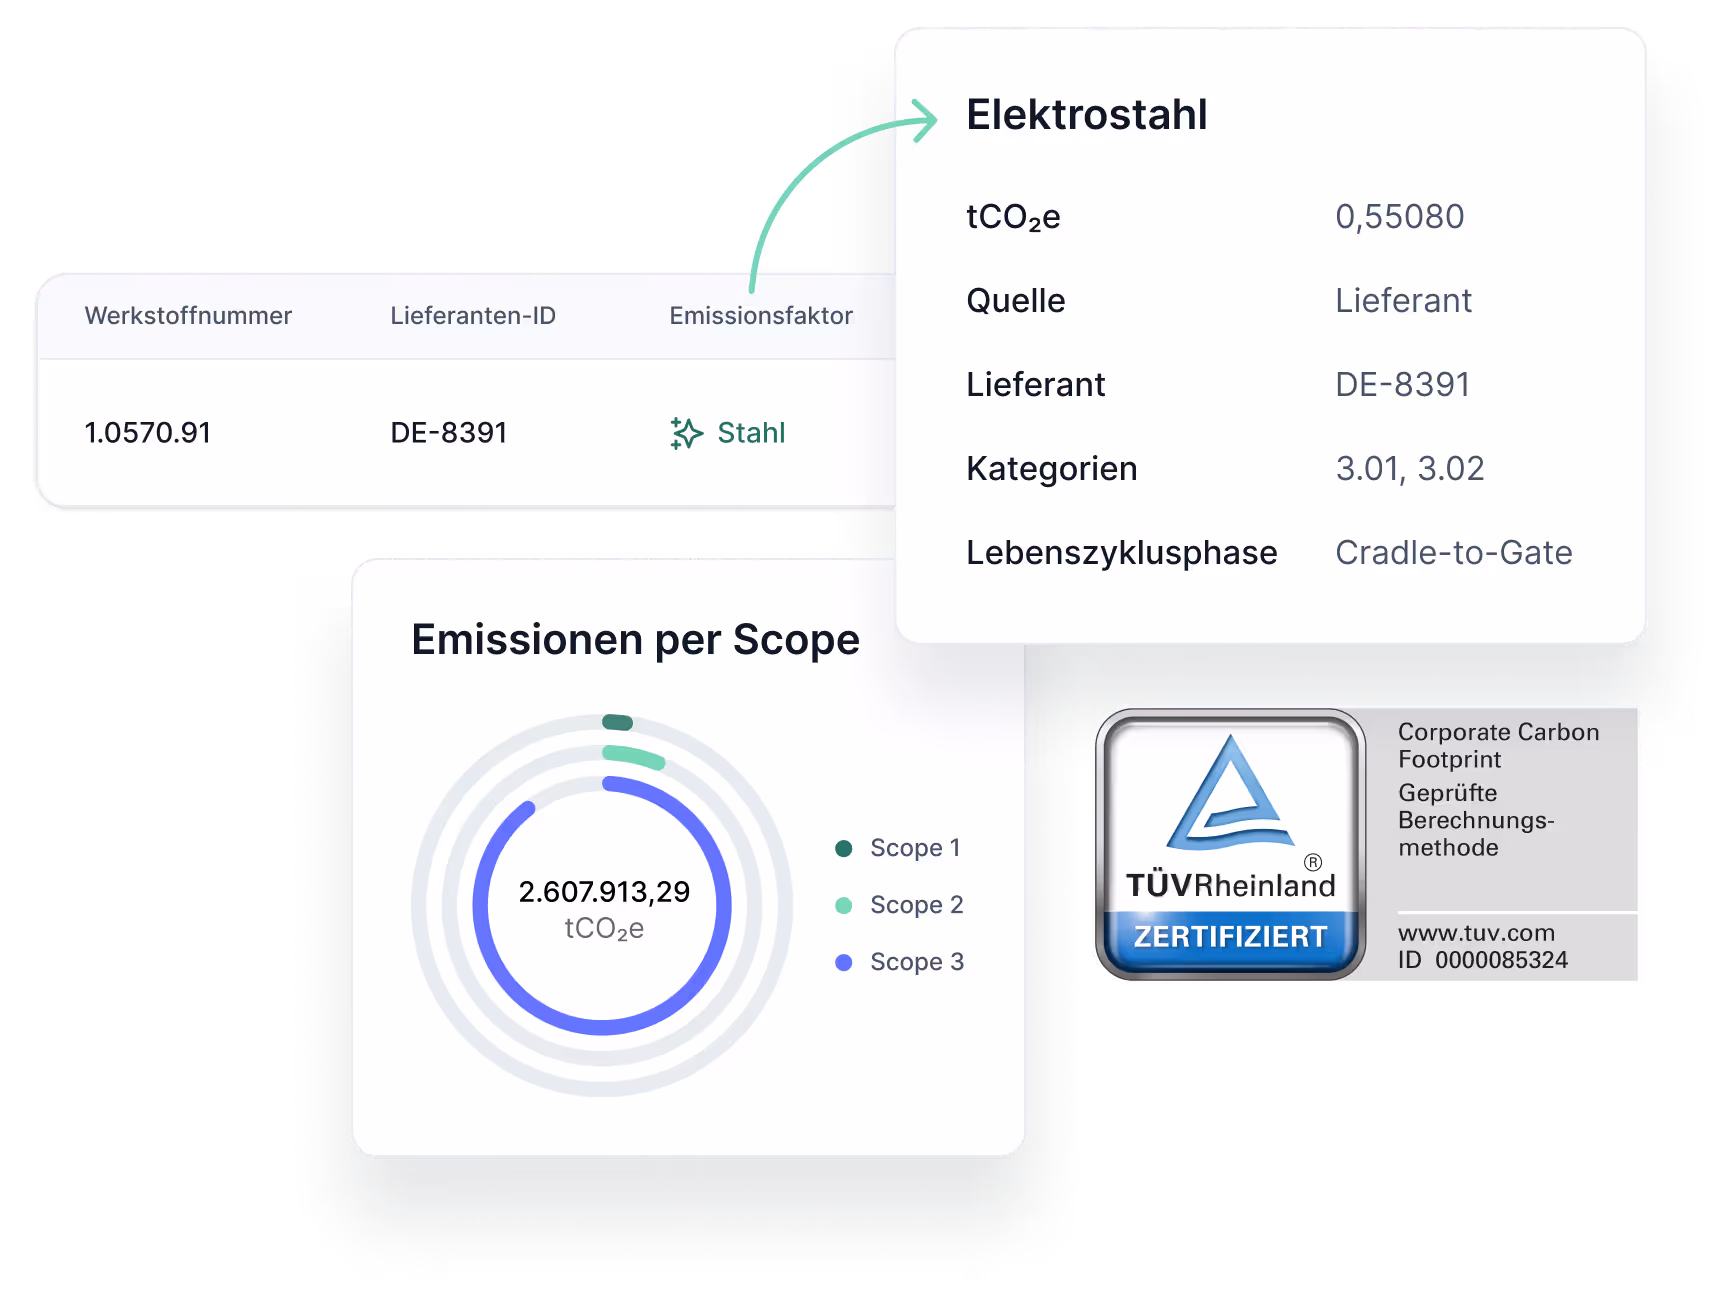
“Thanks to Tanso, we can clearly show which emission factors and values come from which databases. This not only helps us communicate with the outside world, but was also rated as positive by the environmental verifier in the sustainability report review. ”

"With Tanso, we have found a clear and user-friendly tool that promotes our collaboration, offers transparency in the emission factors and guarantees audit security."


"I am positively surprised by the comparability of the results between PCF STARTER, developed by Tanso in cooperation with VDMA, and the much more comprehensive life cycle analysis (LCA) that HEIDELBERG uses for products. Thanks to the simplicity of the tool, PCF STARTER is recommended for all manufacturers who want to start with product-specific carbon accounting. The tool is great to identify emission hotspots."
.avif)
"The Tanso software shows its full strength when used over the long term. Thanks to the stored information and automations, we save around 50% time and effort already in the second year. In addition, we receive informative data on the distribution of our suppliers' CO₂ emissions, which we can continuously collect and refine."


"The Tanso software enabled us to find the relevant data and to process and analyze large volumes of data in a short time. We were able to allocate company emissions to the respective product groups on a pro-rata basis. These valuable findings form the basis for concrete reduction measures."

.avif)
"We are thrilled with the efficient cooperation and the well thought-out software solution from Tanso, which enabled us to create comprehensible carbon accounting for Scope 1 & 2 in a very structured process. For this reason, we are looking forward to continuing the cooperation and successfully do a carbon accounting for Scope 3 for the first time as well."


.png)
“Das CSRD-Modul von Tanso überzeugt uns mit einer klaren Struktur – von der doppelten Wesentlichkeitsanalyse bis zur effizienten Datenerhebung. Anstelle unübersichtlicher Excel-Tabellen profitieren wir von einer benutzerfreundlichen Oberfläche. Besonders die integrierte KI erleichtert Routineaufgaben und bietet wertvolle Unterstützung in der Anfangsphase.”

Dominik Schwarz


Implementation, regulatory details, and more. Find your answers here.
The corporate carbon footprint (CCF) is a key indicator for supplier portals and rankings/ratings. OEMs are increasingly demanding transparent and measurable sustainability data in order to reduce the environmental impact along the value chain. It is also crucial in assessment models such as those of EcoVadis or the CDP, as these take climate performance into account as an important criterion.
The following is an excerpt from the available databases:
GHG protocol: A globally recognized standard for recording and reporting greenhouse gas emissions.
ISO 14064: Focuses on quantifiable, auditable reporting at company level.
ISO 14067: Refers specifically to the greenhouse gas balance of products.
CDP: Platform for disclosing environmental information such as emissions and climate risks.
GRI: Standards for comprehensive sustainability reporting, including environmental, social and governance issues.
Scope 3 emissions account for around 90% of a corporate carbon footprint, but the data is often difficult to access. Its collection requires close cooperation with suppliers, and complex calculation methods lead to uncertainties in accuracy.


